This is a Forecast Webpage. This utilizes the UCSD kinematic model analyses speeds, densities and GSM Bz fields, at the location of Earth, to compute a predictive Planetary K-Index. This prediction is then plotted with the GFZ Potsdam Kp This forecast analysis extends the Bz field coordinate throughout the heliosphere in low resolution in order to provide a forecaster the ability to determine the closeness of the predicted value of Bz to an alternate measure. Here we also plot interplanetary scintillation (IPS) speeds and density that can help a forecaster determine likelihood of enhanced geomagnetic storm activity. Older formats using ISEE IPS data, can be found at: http://ips.ucsd.edu. An archive of these analyses can be found at: Real-Time Data (anonymous ftp images and data).
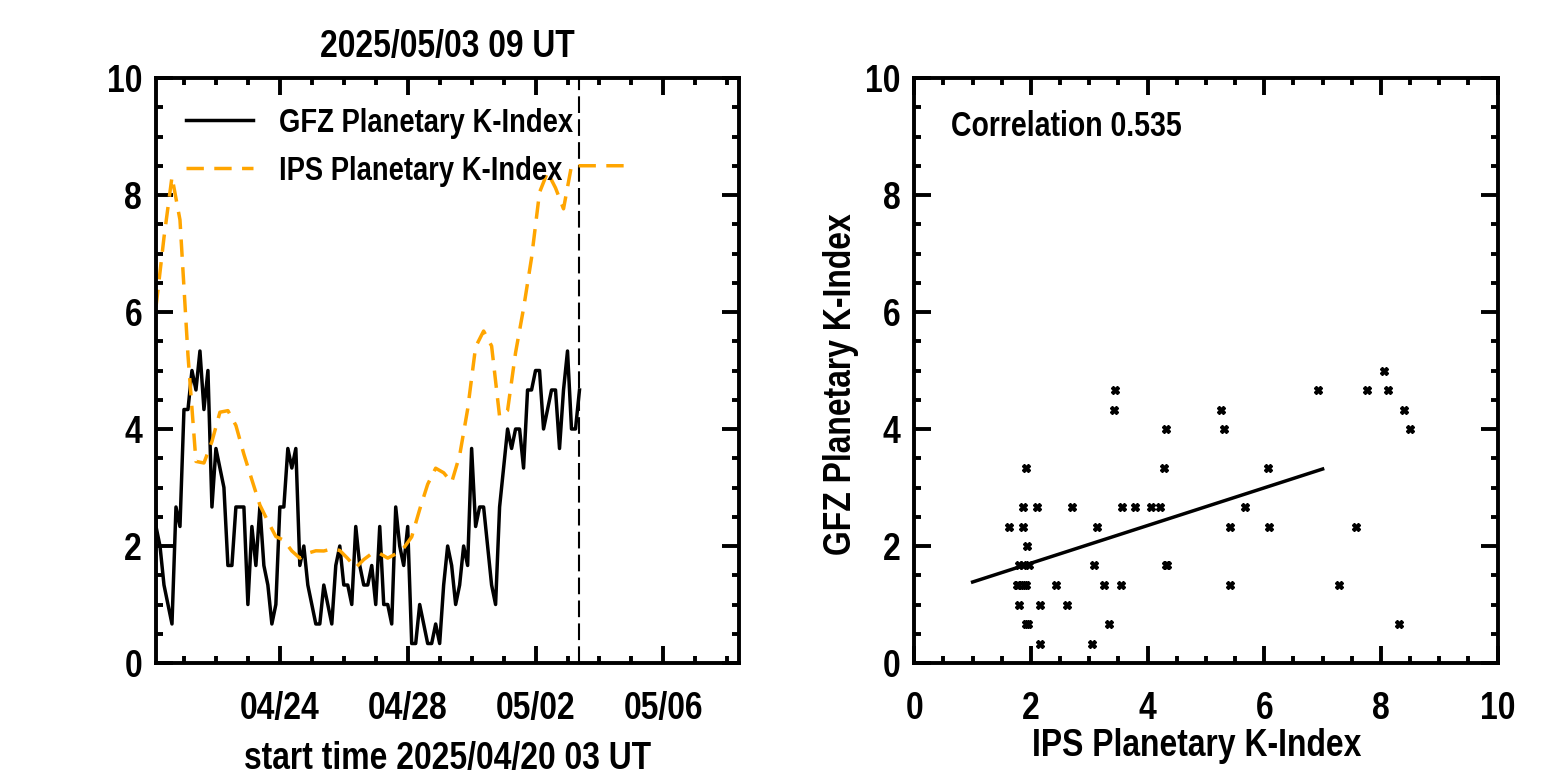
Planetary K-index
|
|
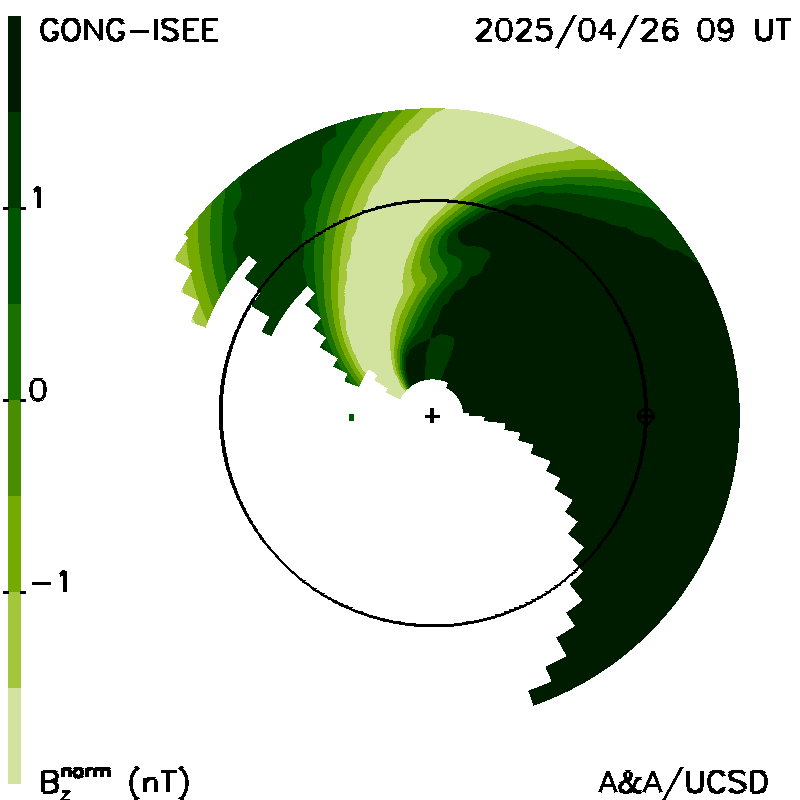
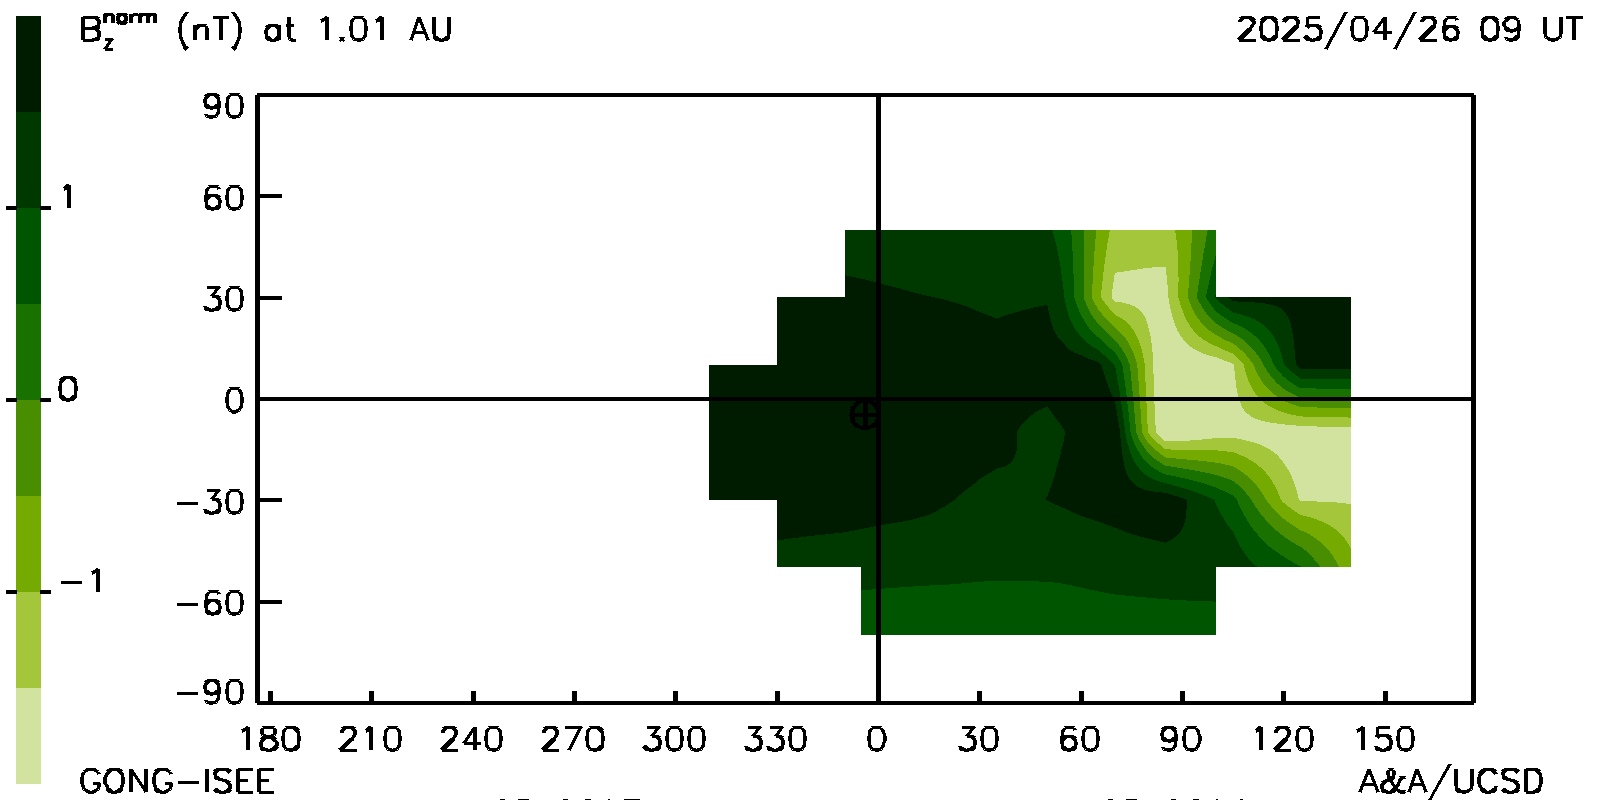
Bz Magnetic Field Extended across the Heliosphere in GSM Coordinates
|
|
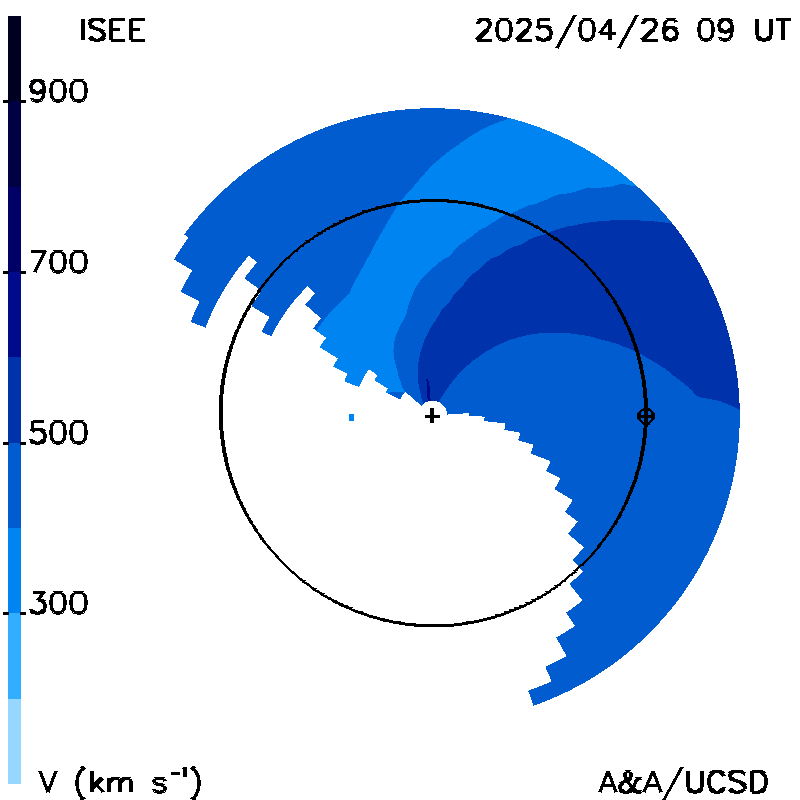
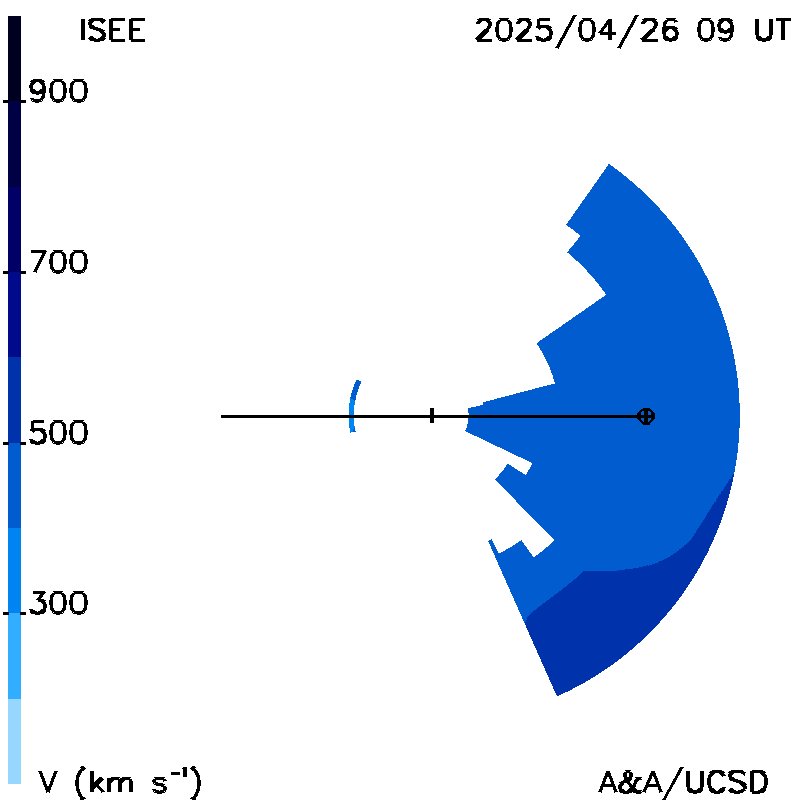
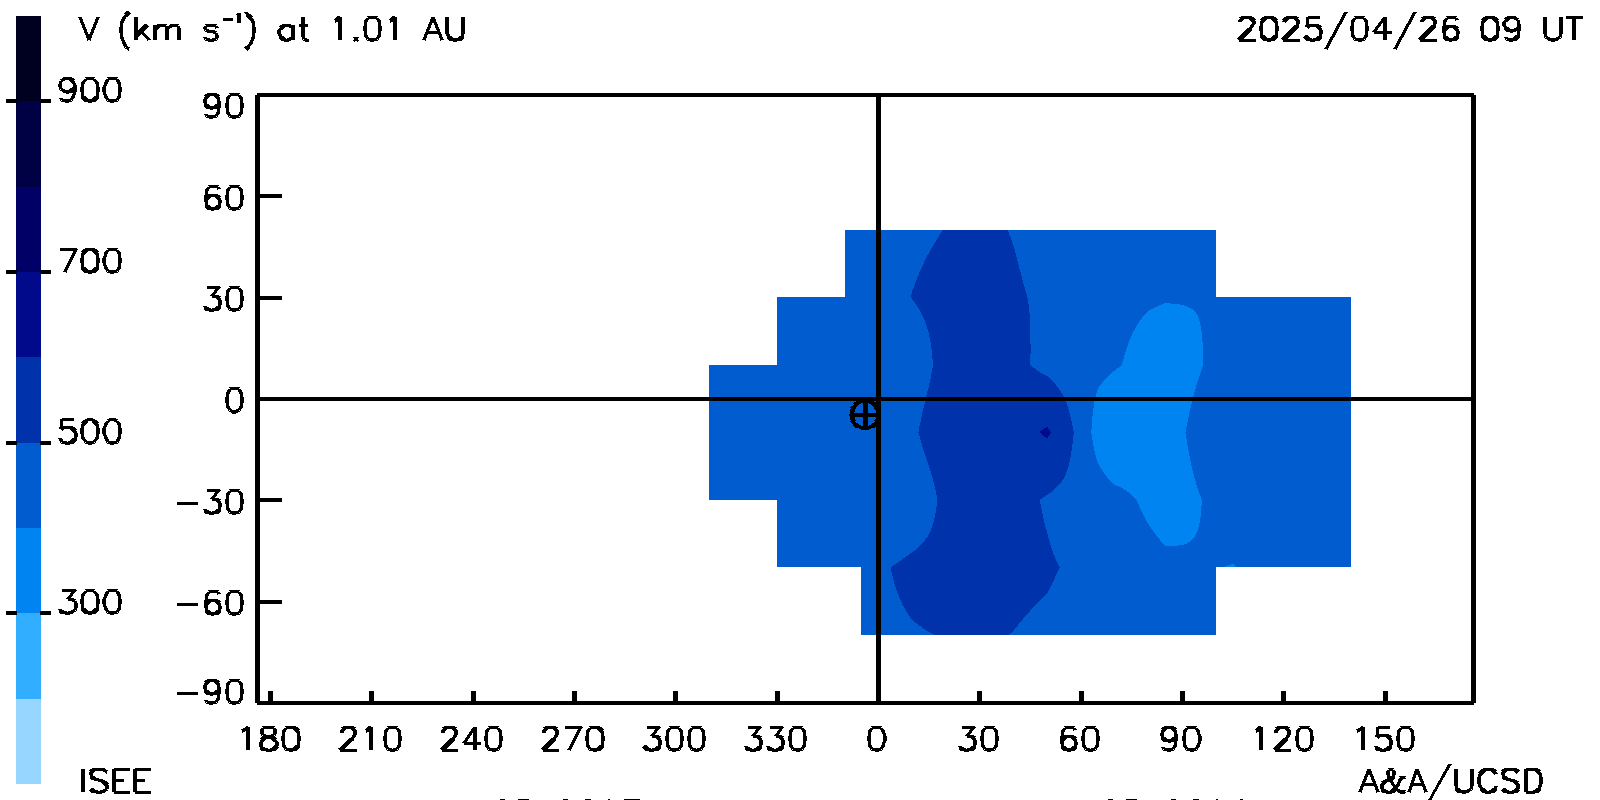
Radial Velocity 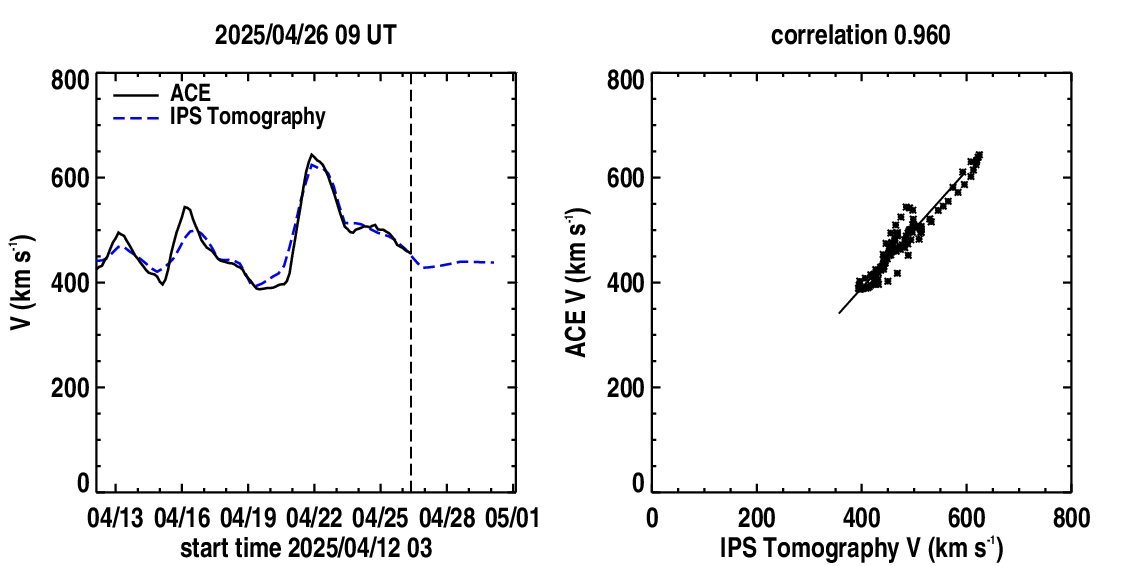
|
|
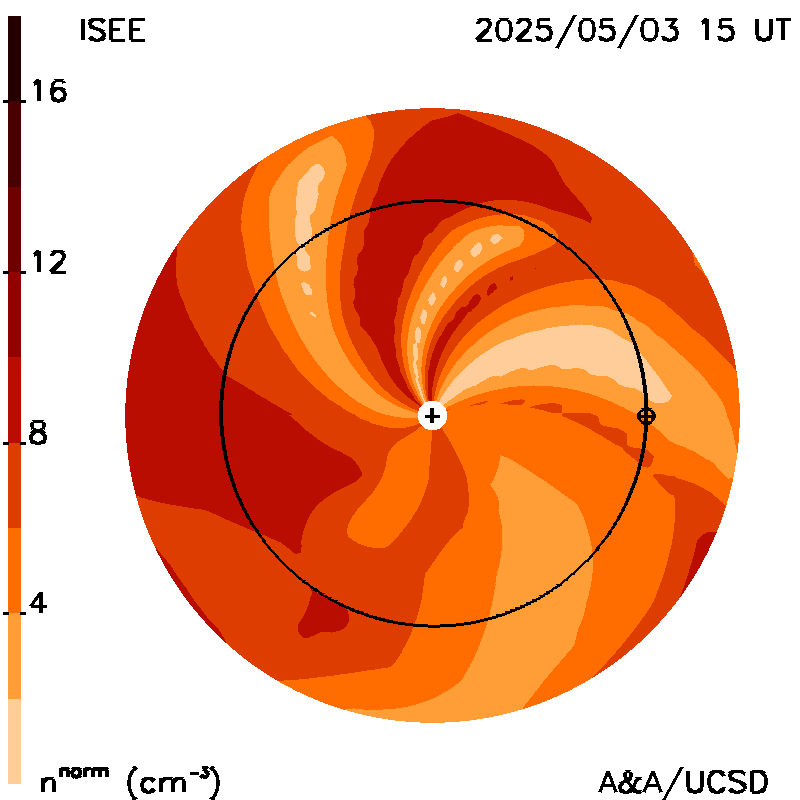
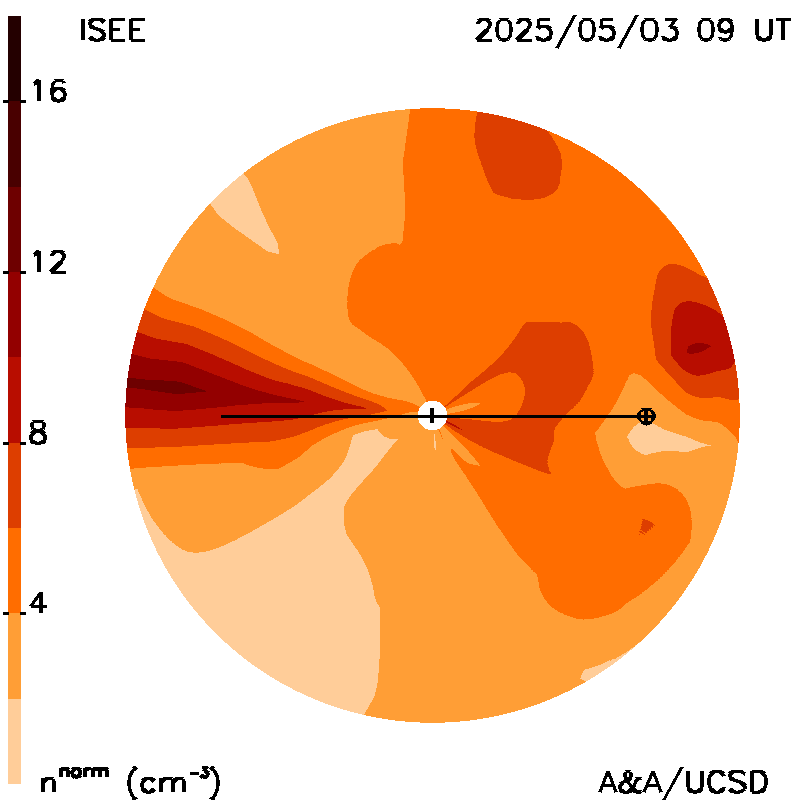
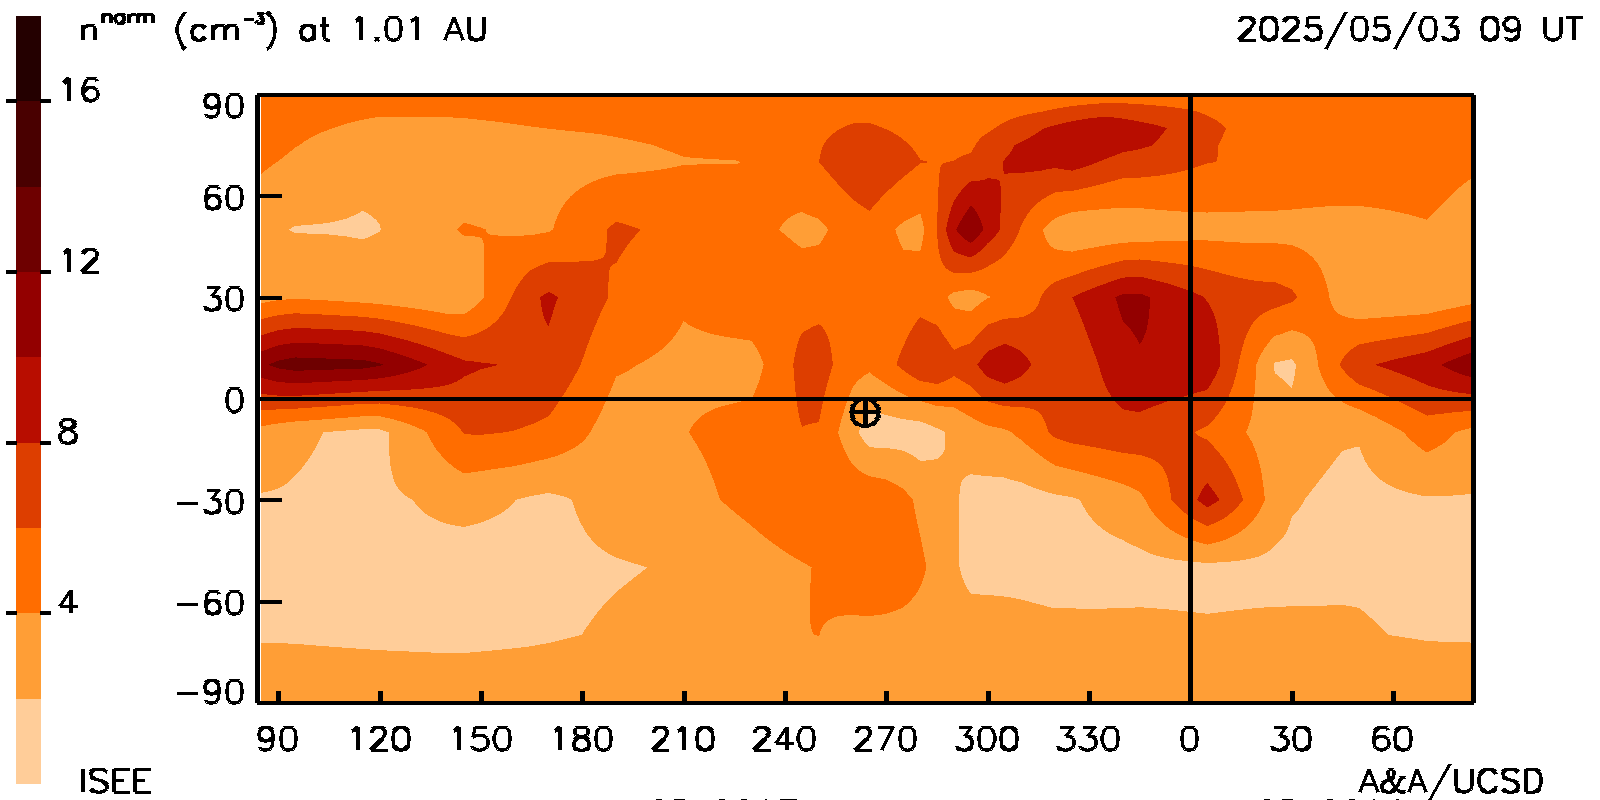
Density 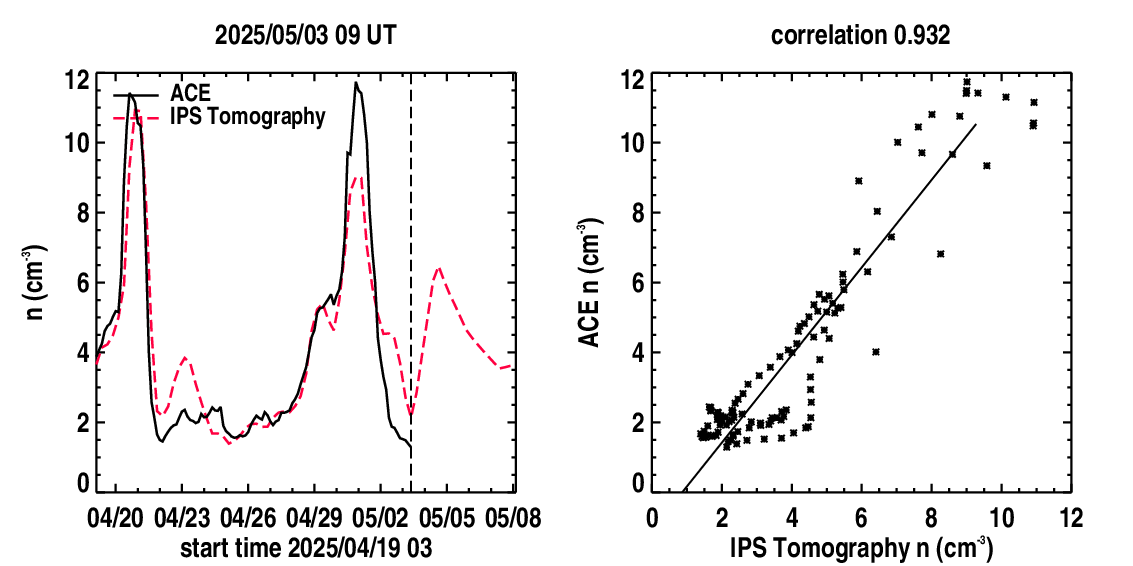
|
Planar cuts along the ecliptic: These show "extended" GSM Bz fields (normalized to 1 AU), solar wind densities, and radial velocities as planar cuts along the ecliptic within 6 hours of the current time. Magnetic fields are extrapolated upward from the solar surface. The Sun is in the center; Earth is shown in its orbit around the Sun. The maps are derived from a tomographic time-dependent model of the solar wind that is fit to interplanetary scintillation (IPS) velocities and g-levels obtained daily from ISEE, Japan. The model is updated every six hours.
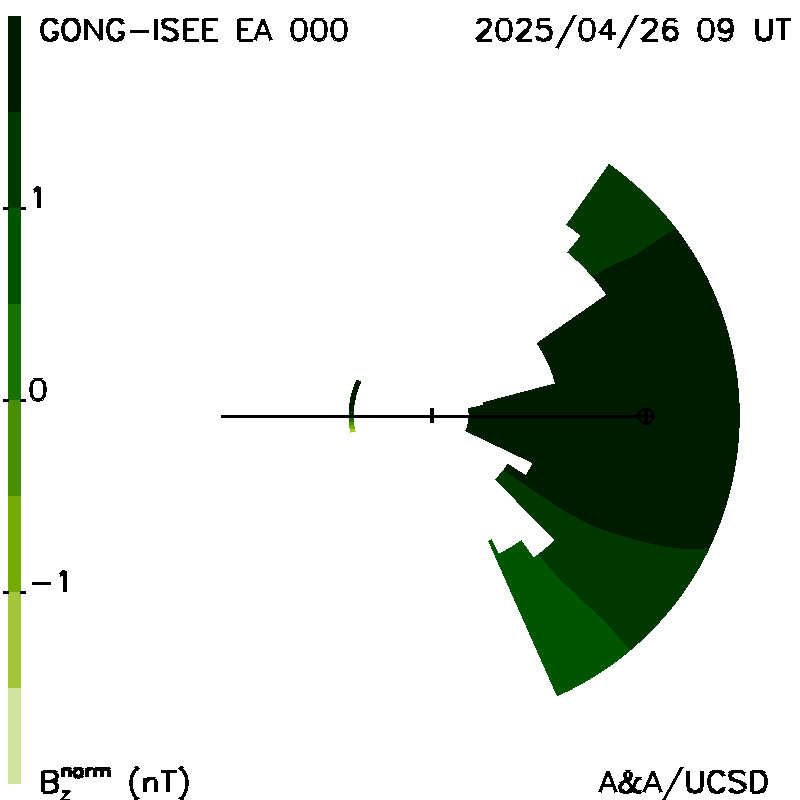
Planar cuts at the Earth's meridian: These show "extended" GSM Bz fields (normalized to 1 AU), solar wind densities, and radial velocities as north-south planar cuts at the Earth's meridian at the same time as the ecliptic cut. The Sun is in the center; Earth is shown on its orbit to the right of the image.
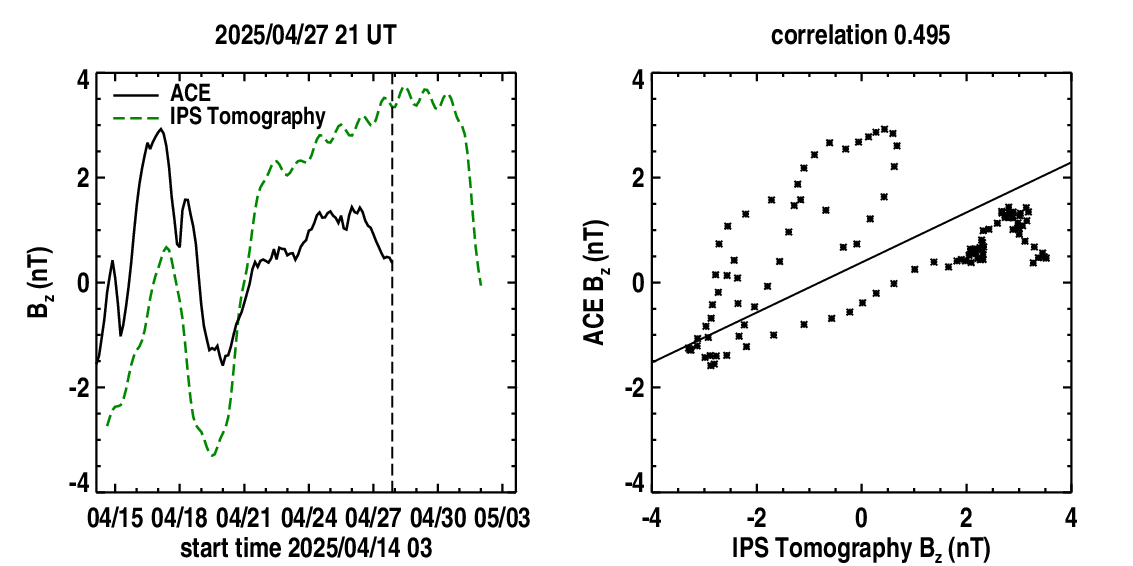
Time series plots: Near-Earth solar wind magnetic field parameters of Bz (in GSM coordinates with daily smoothing to eliminate diurnal variations) and radial solar wind velocities from the time-dependent tomography model (dashed curves). These are shown in comparison with Advanced Composition Explorer (ACE) spacecraft Bz component magnetic field data (solid curves) and ACE solar wind speeds. A vertical dashed line indicates the GMT run time of the tomography program that is provided above the time series. The Pearson's "R" correlation between the model and observed values of each parameter are shown up to the time there are no more spacecraft data available. The time series is updated every six hours at the same time as the volumetric cuts. The prediction of the future parameter values begins at the location of the vertical dashed line where the observed values end. Look for a significant correlation of enhanced Kp values or decreased Dst values when the Bz field goes southward. This is forecast several days in advance from coupling primarily associated a positively directed tangential (Bt) field especially in the spring and fall.