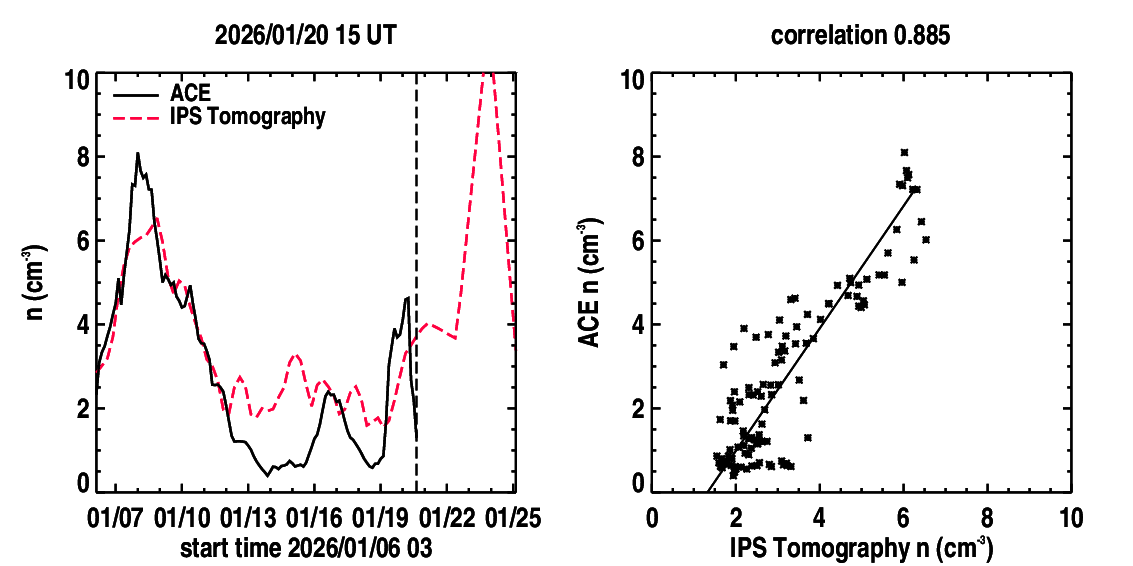
ACE Density
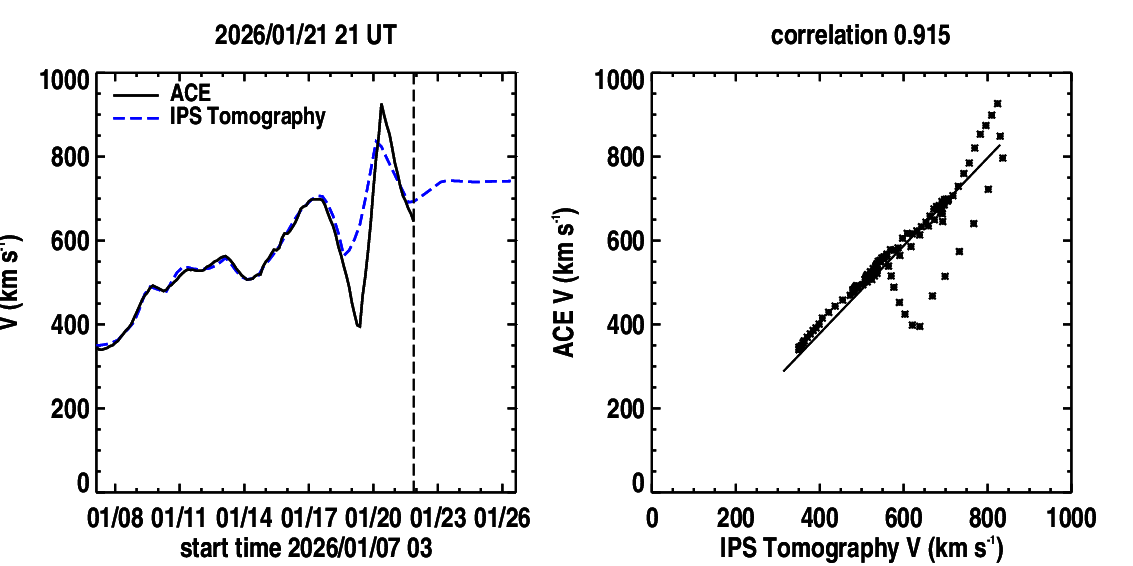
ACE Velocity
Most of these kinematic model analyses, in older formats using ISEE IPS data, can be found at: http://ips.ucsd.edu. A different kinematic model version is operated at the Korean Space Weather Center (KSWC). The analyses used to drive ENLIL in near real time can be found at George Mason University, and at the KSWC. An archive of the IPS analyses can be found at: Real-Time Data (anonymous ftp images and data).
|
ACE Density
|
ACE Velocity
|
|
CELIAS Density 
|
CELIAS Velocity
|
|
DSCOVR Density 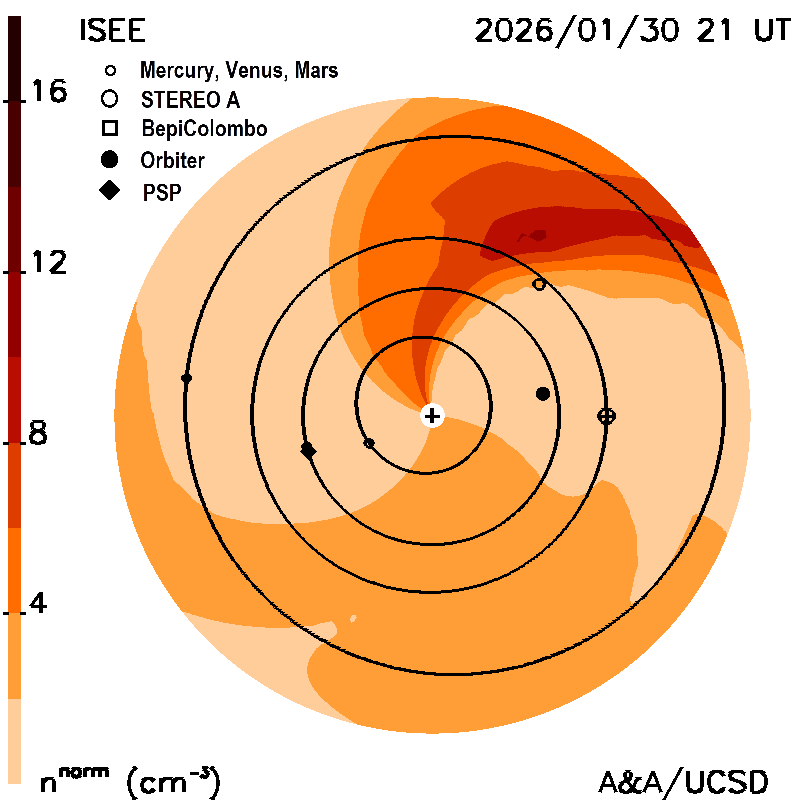
|
DSCOVR Velocity
|
|
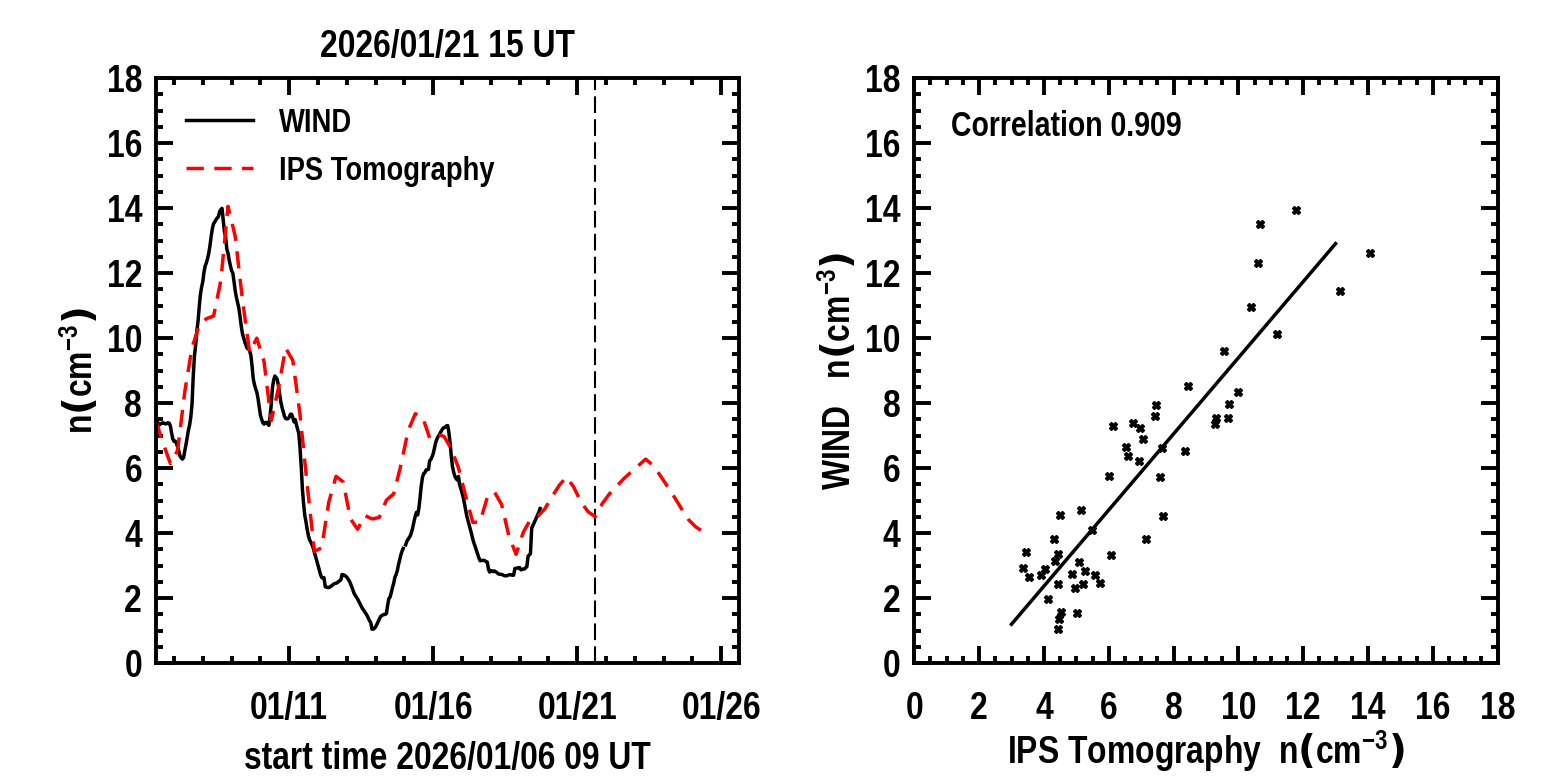
Wind Density 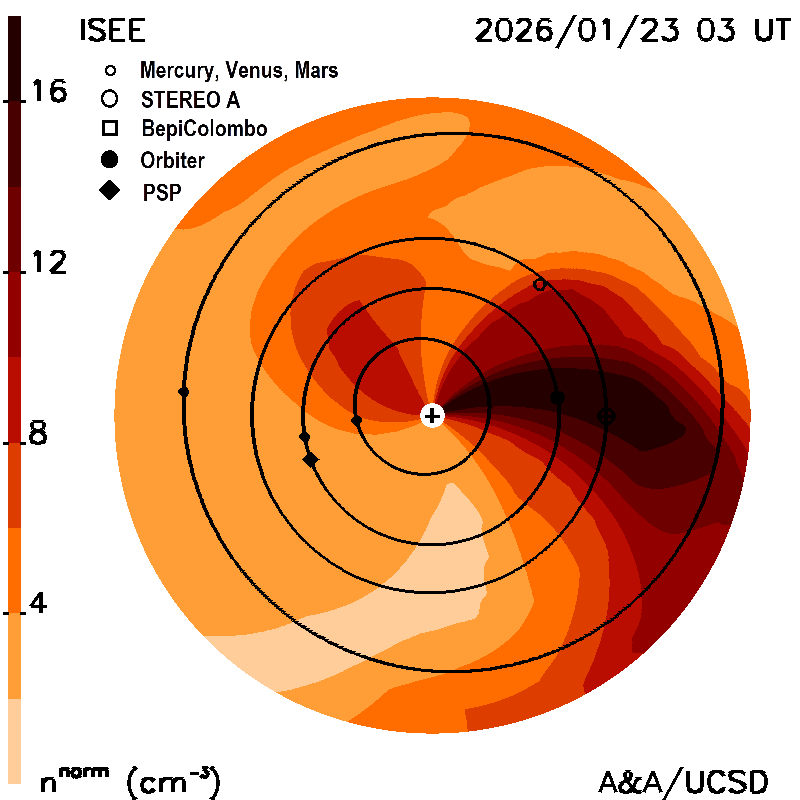
|
Wind Velocity
|
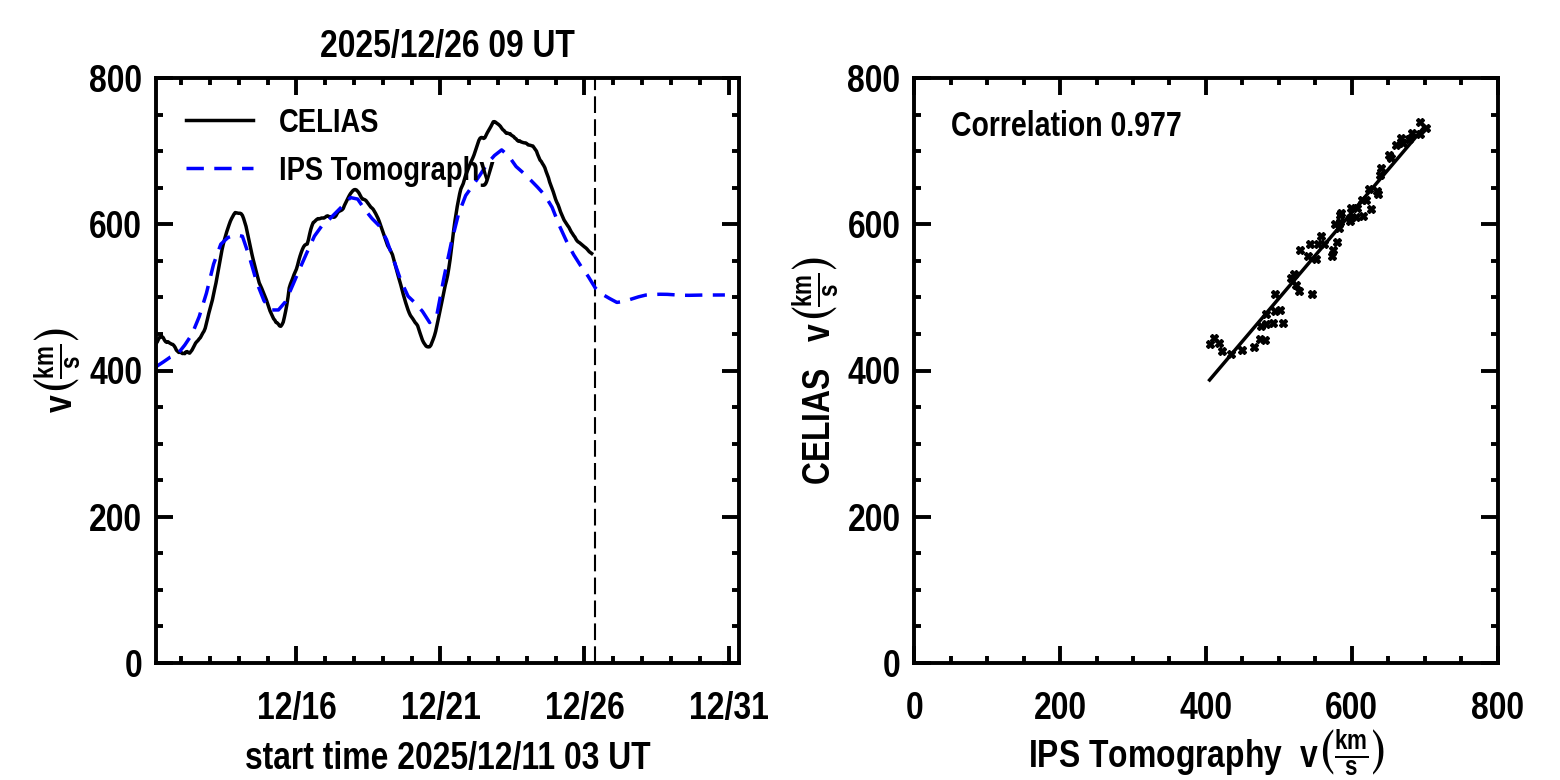
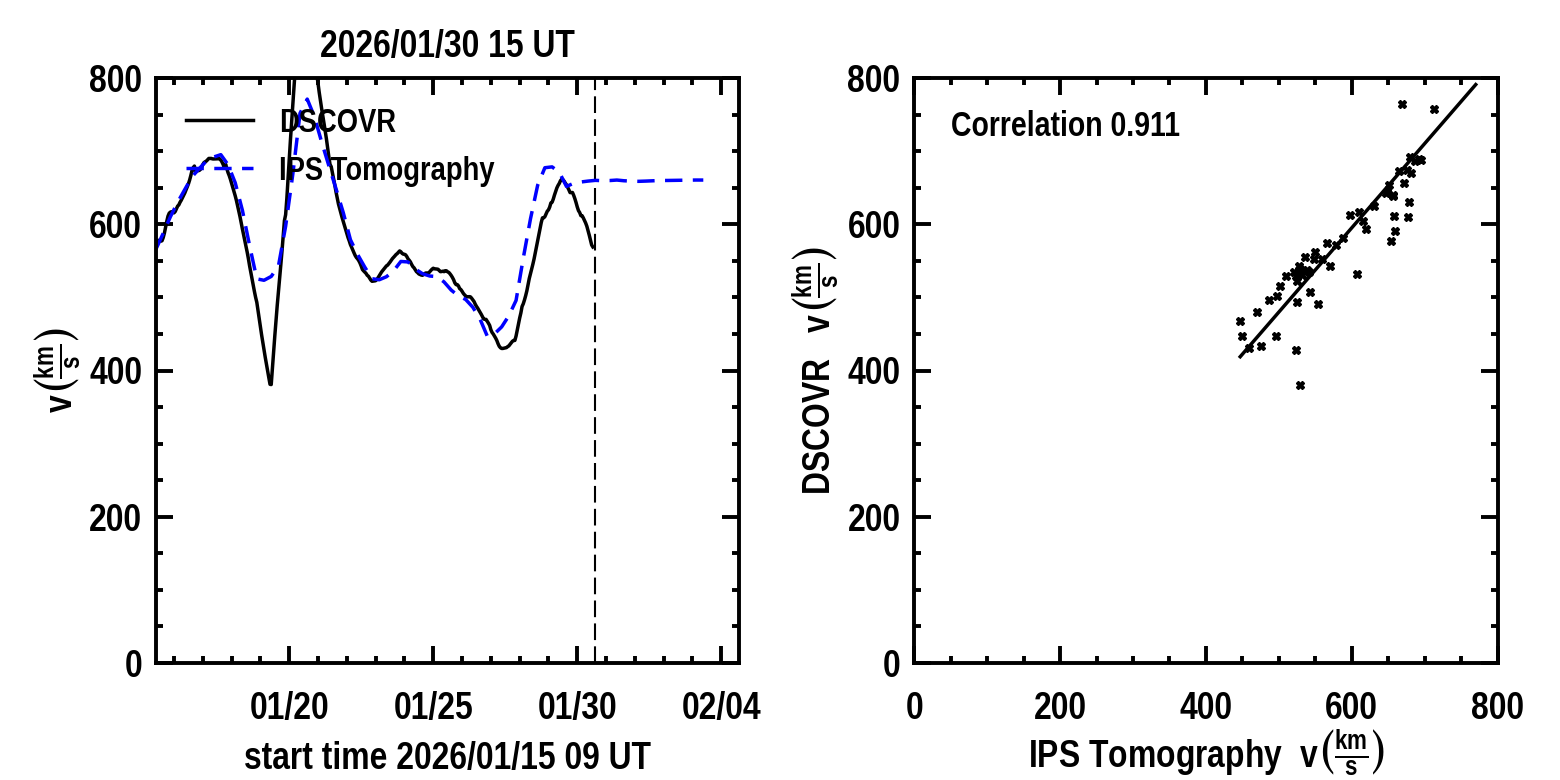
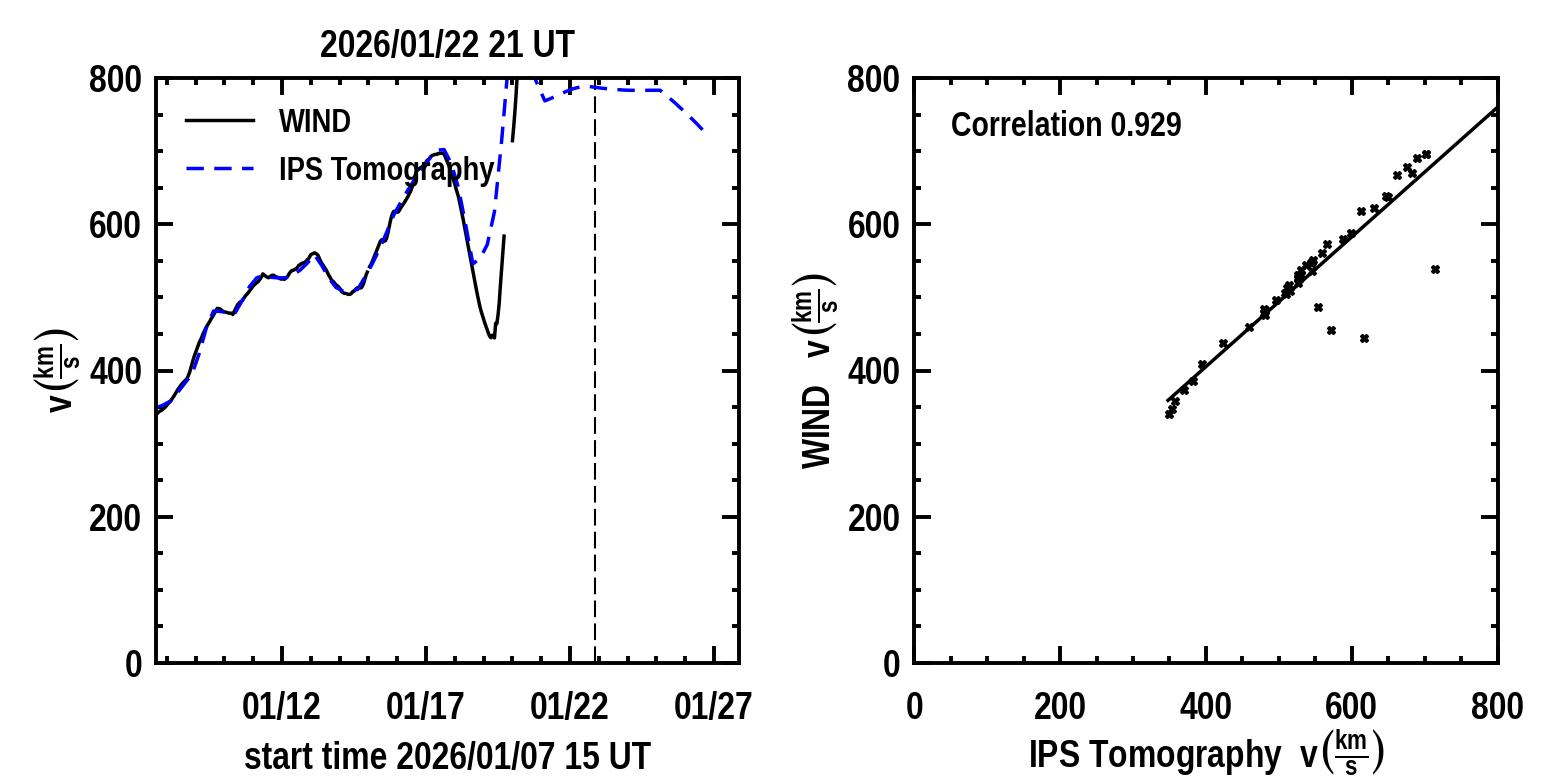
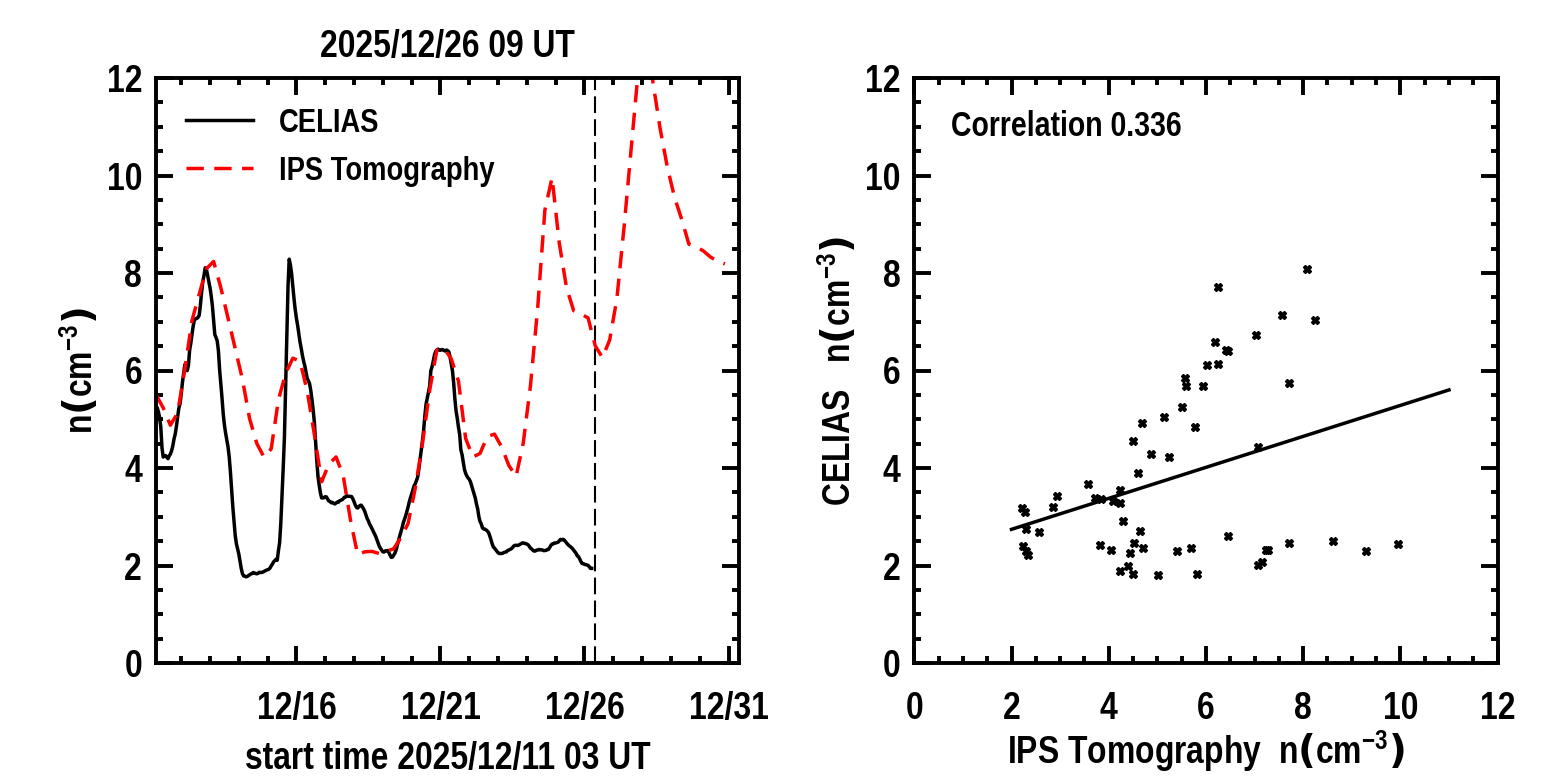
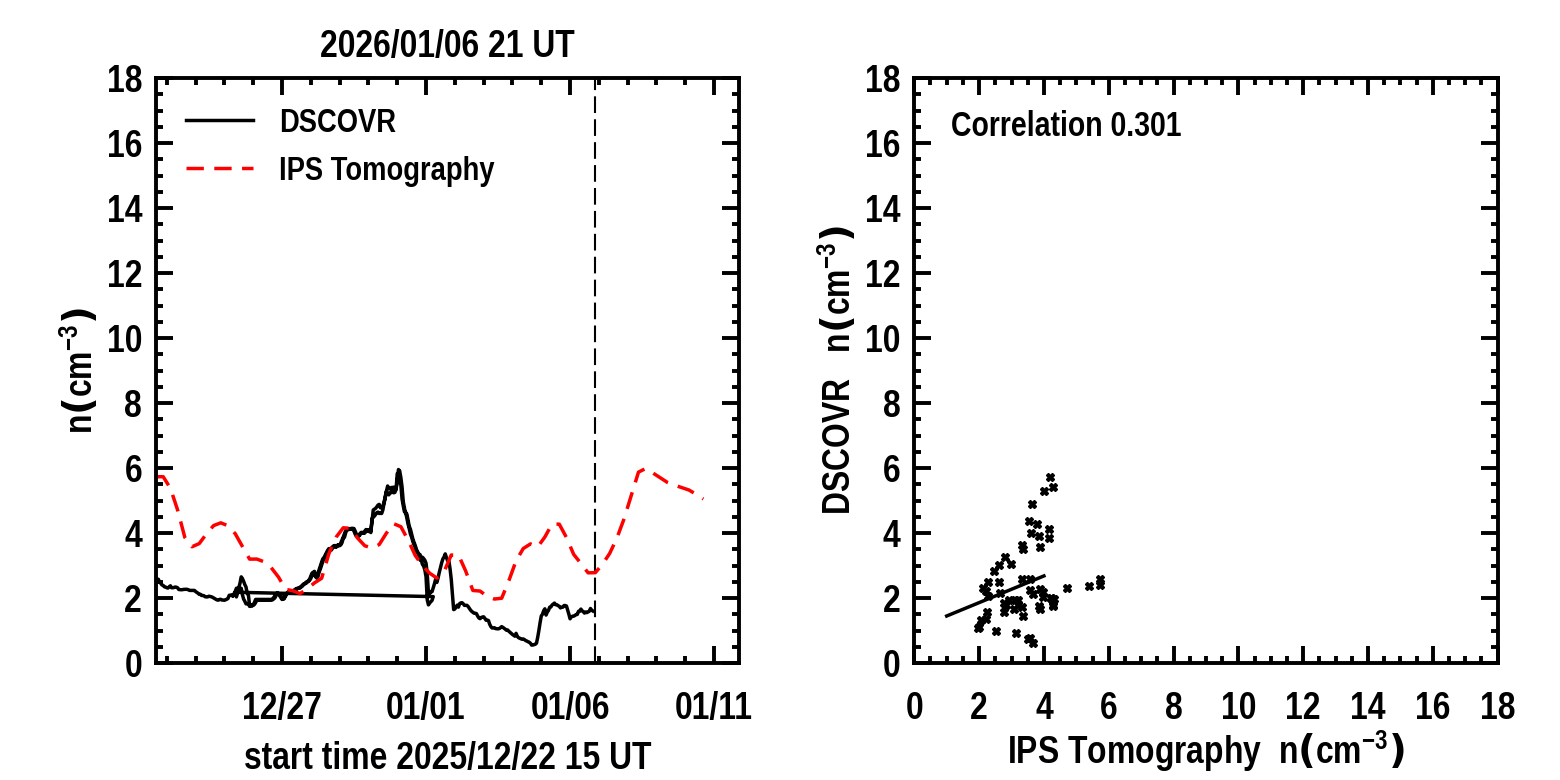
Four different near-Earth spacecraft density and velocity measurements are compared in these analyses derived from the UCSD kinematic tomographic time-dependent modeling. These analyses are from new fits every six hours to interplanetary scintillation (IPS) g-levels and velocities obtained daily from ISEE, Japan. The in-situ density measurements from each different spacecraft provide a density mean value for scintillation level (g-level = 1.0) and the analysis proceeds to fill global densities accordingly; velocity measurements are presented without normalization (see Jackson et al.; Solar Phys., 2013, 258, 151-165). The different analyses are then compared with each of the spacecraft’s measurements to determine which fit is best using a Pearson’s “R” correlation
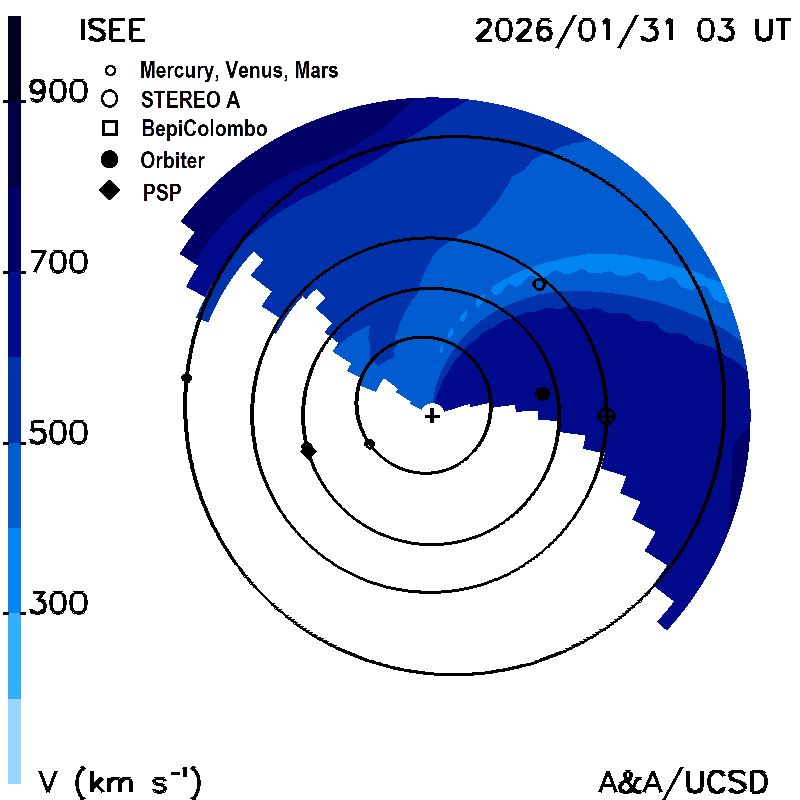
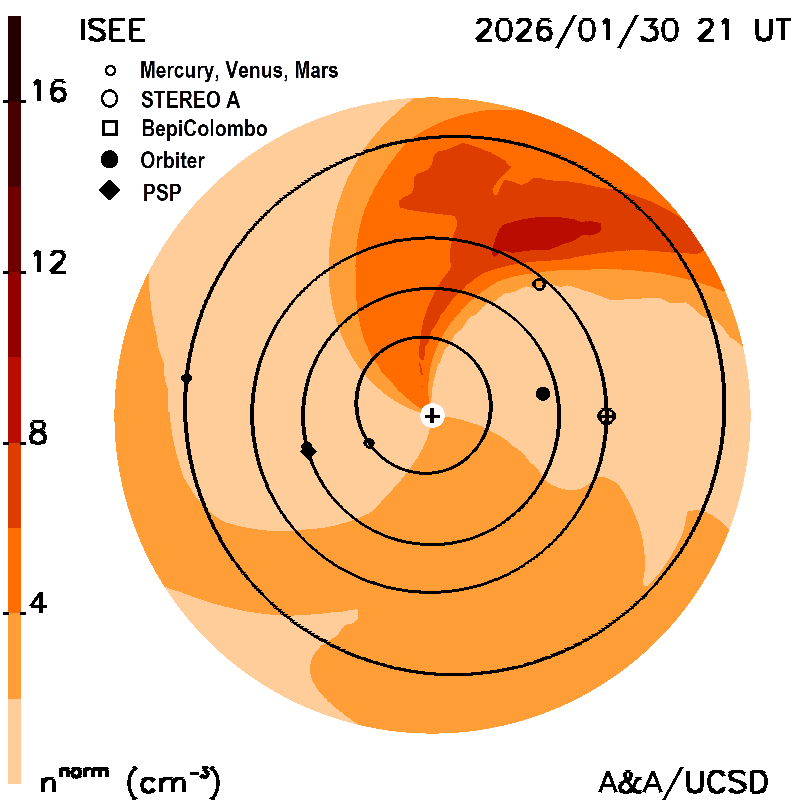
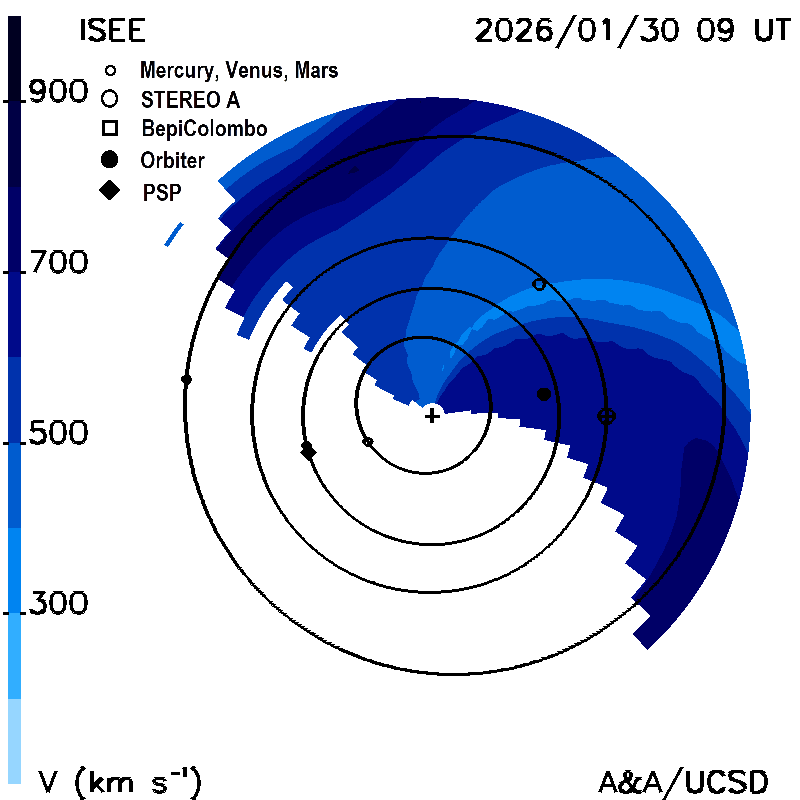
Planar cuts along the ecliptic: These show the density (normalized to 1 AU) and velocity, as planar cuts along the ecliptic within 3 hours of the current time. The Sun is in the center; Earth is shown in its orbit around the Sun. The inner planets and their orbits, Parker Solar Probe, BepiColombo, and Solar Orbiter locations are shown.
Time series plots: Near-Earth solar wind parameters density and radial velocity derived from the time-dependent tomography model (dashed curves) shown in comparison with different spacecraft velocity and density (solid curves). A vertical dashed line indicates the GMT run time of the tomography program that is provided above the time series. The correlation between the model and observed values of each parameter are shown up to the time there are no more spacecraft data available. The time series display is updated every six hours at the same time as the volumetric cuts. The forecast of the future parameter values at Earth begins at the location of the vertical dashed line where the observed values end.