|
Density 1.8AU 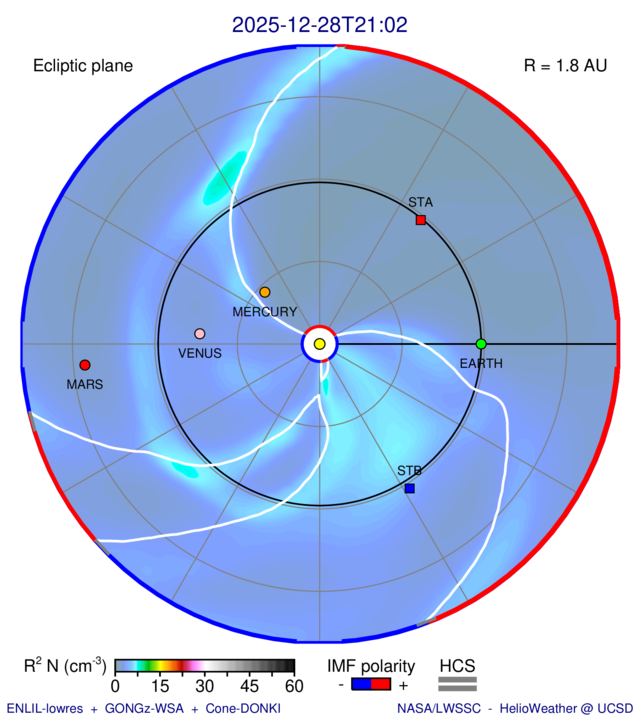

Velocity 1.8AU 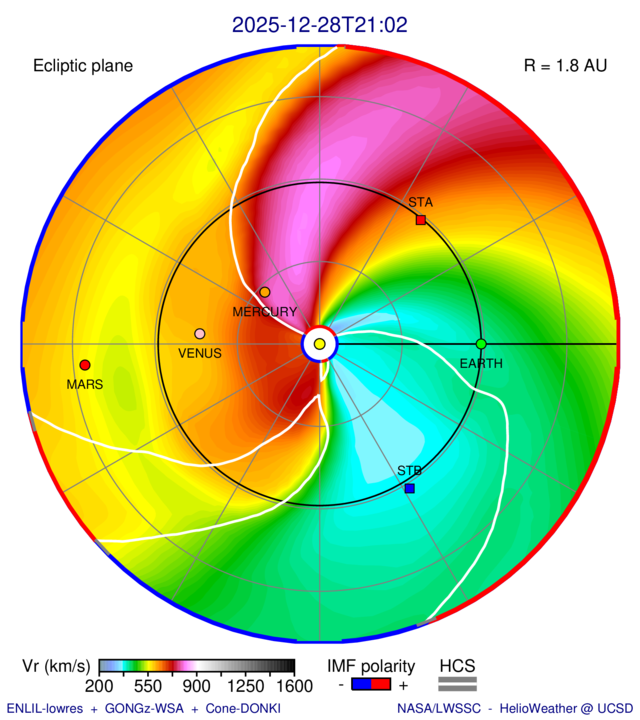

1.8AU Overview 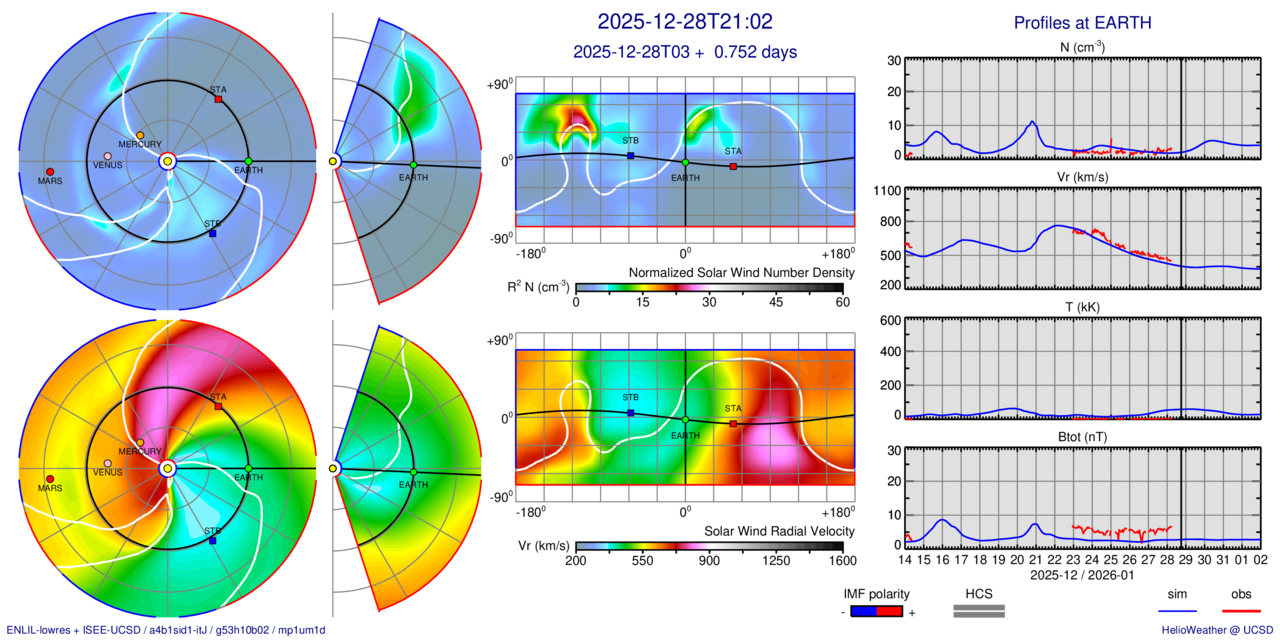
|
Most of these kinematic model analyses, in older formats using ISEE IPS data, can be found at: http://ips.ucsd.edu. A different kinematic model version is operated at the Korean Space Weather Center (KSWC). The analyses used to drive ENLIL in near real time can be found at George Mason University, and at the KSWC. An archive of the IPS analyses can be found at: Real-Time Data (anonymous ftp images and data). This analysis contrasts the difference between the kinematic model and the ENLIL 3-D MHD model driven by IPS boundaries of velocity and density and magnetic field. The UCSD kinematic modeling that conserves mass and mass flux does well to provide densities, velocities, and magnetic fields at Earth. However, we know that the kinematic modeling density values are no accurate at large distances from the Sun because shock processes are not supported by this modeling. With this analysis we wish to explore the validity of both models to these large solar distances.
|
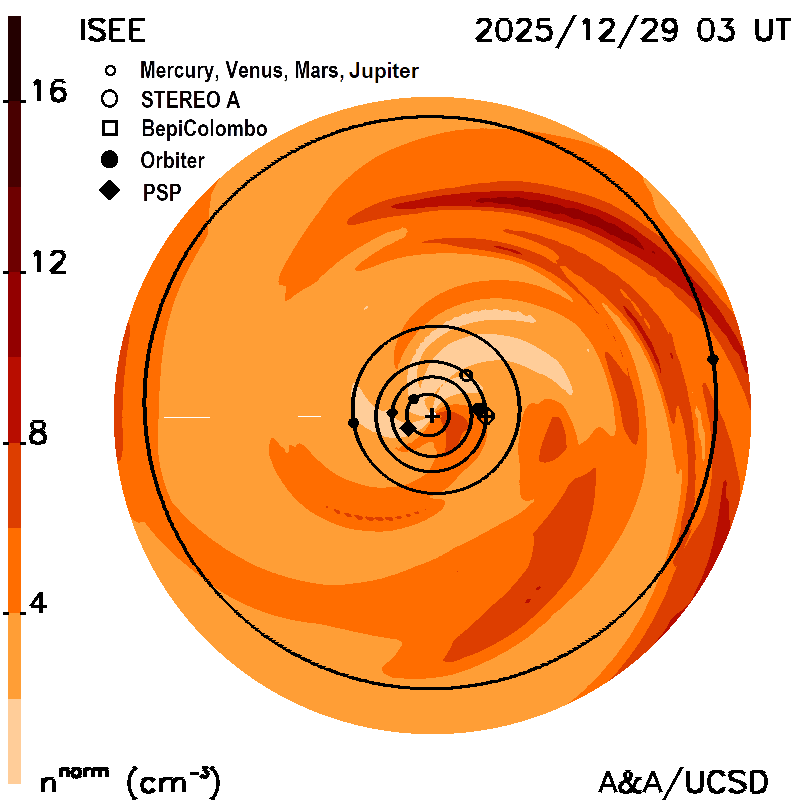
Density 1.8AU
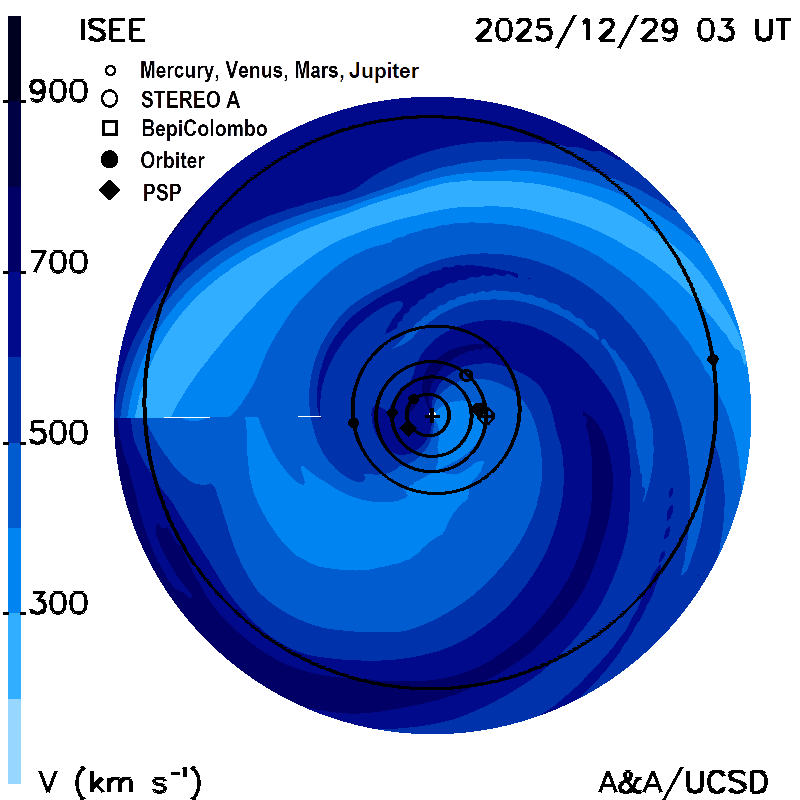
Velocity 1.8AU
1.8AU Overview
|
|
Density 5.8AU 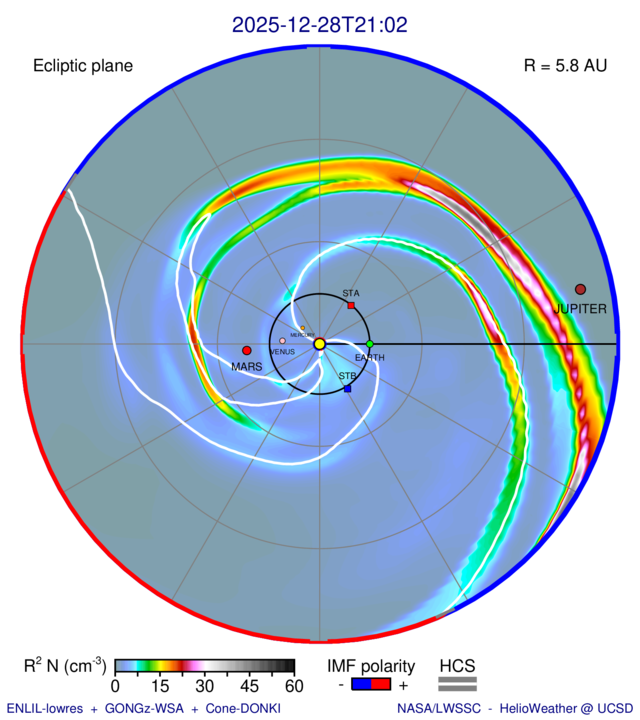
Velocity 5.8AU 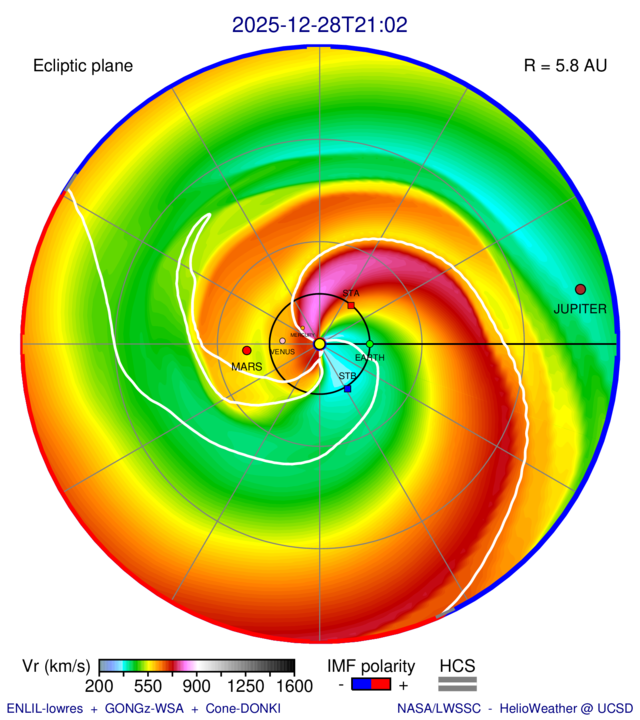
Density Time Series 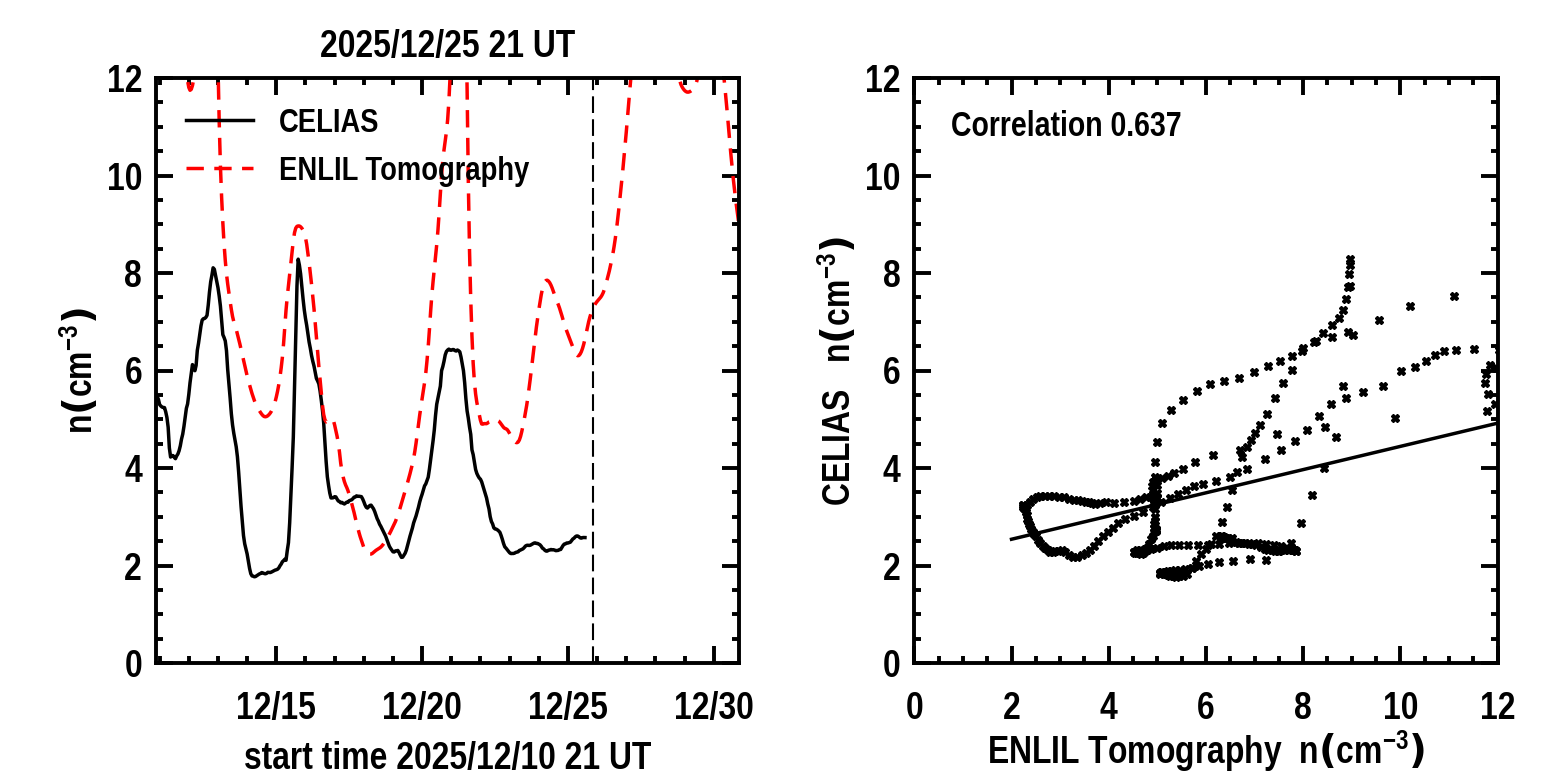
Density Hour Intervals 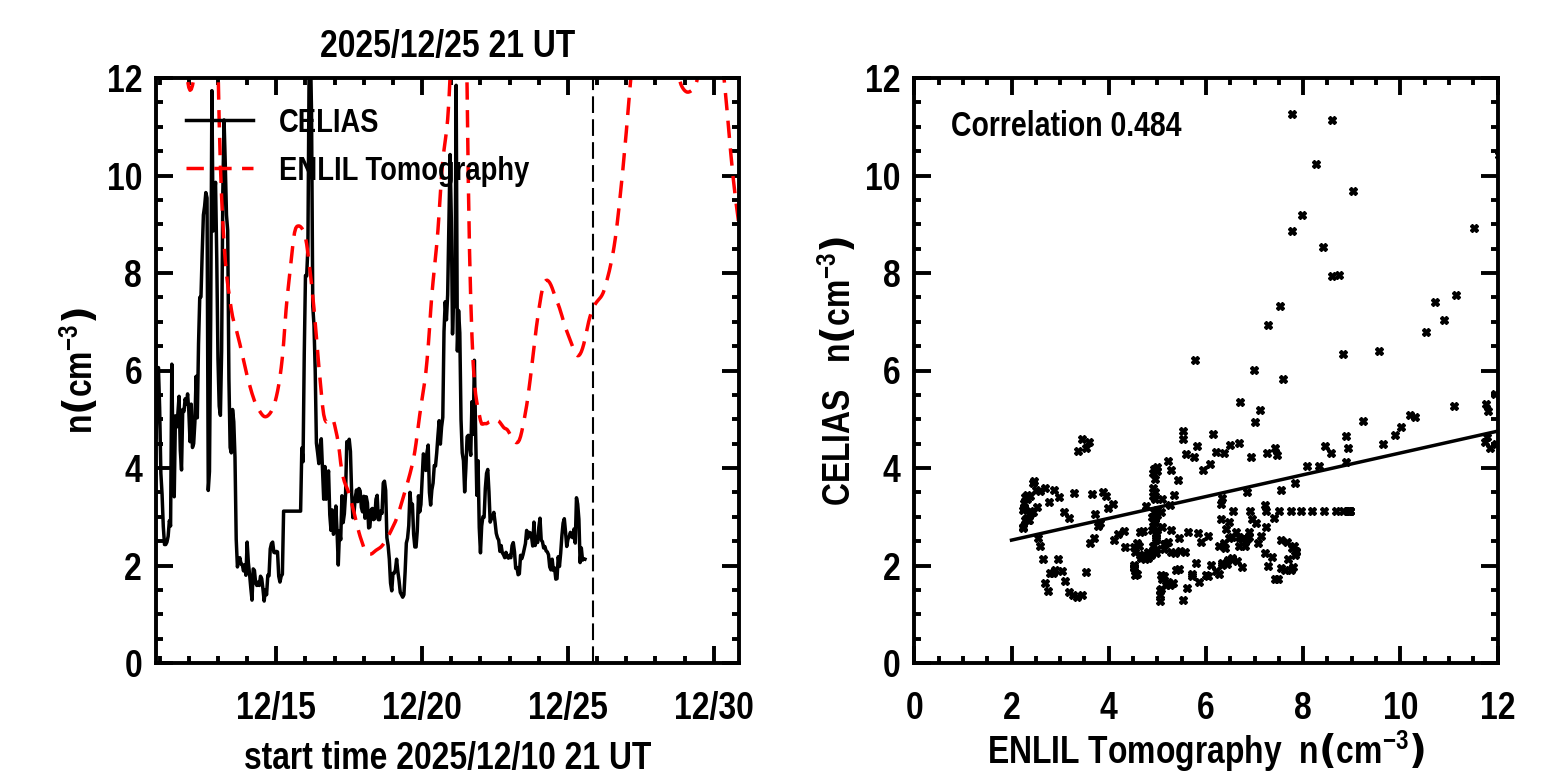
Velocity Time Series 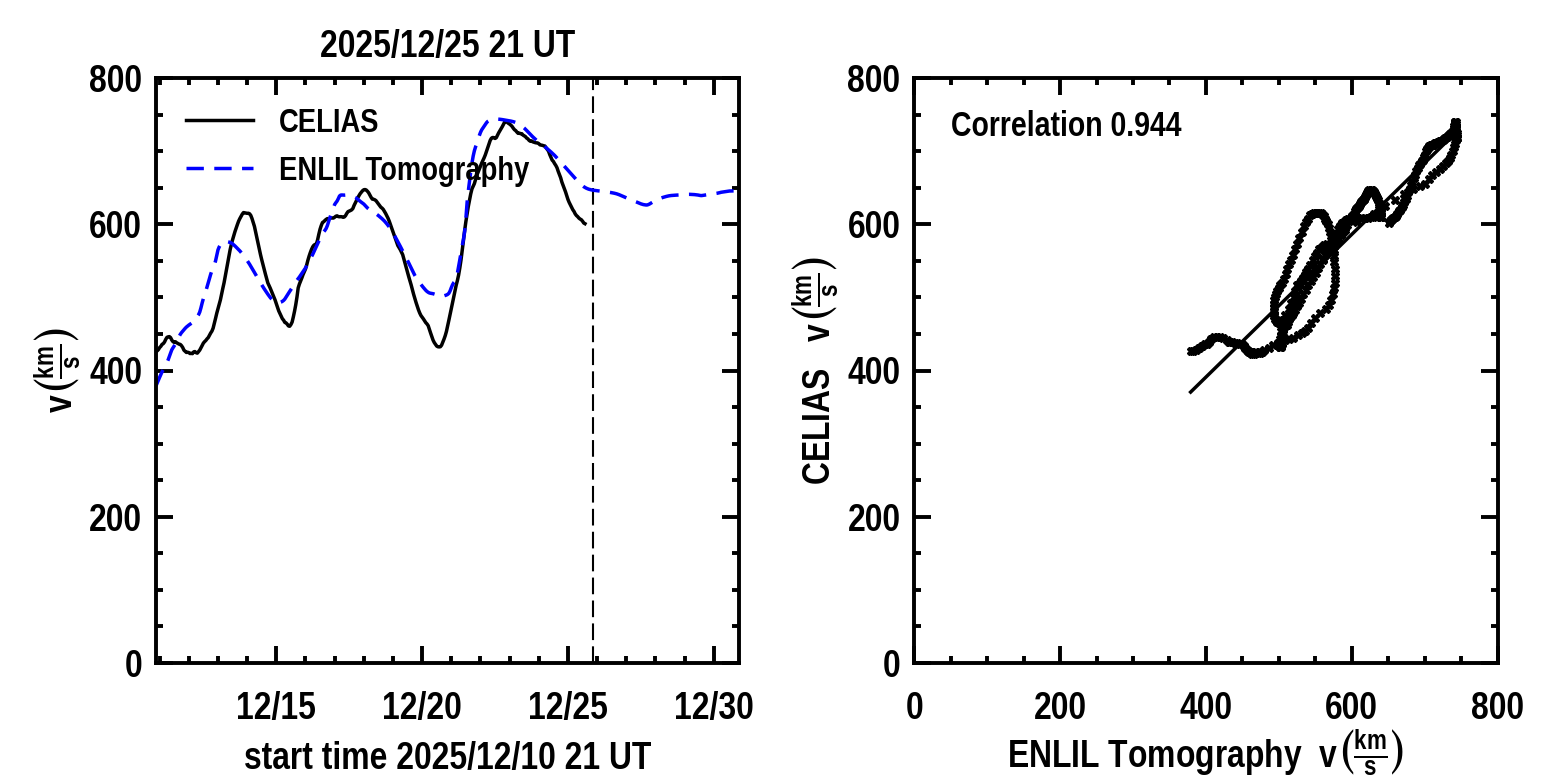
Velocity Hour Intervals 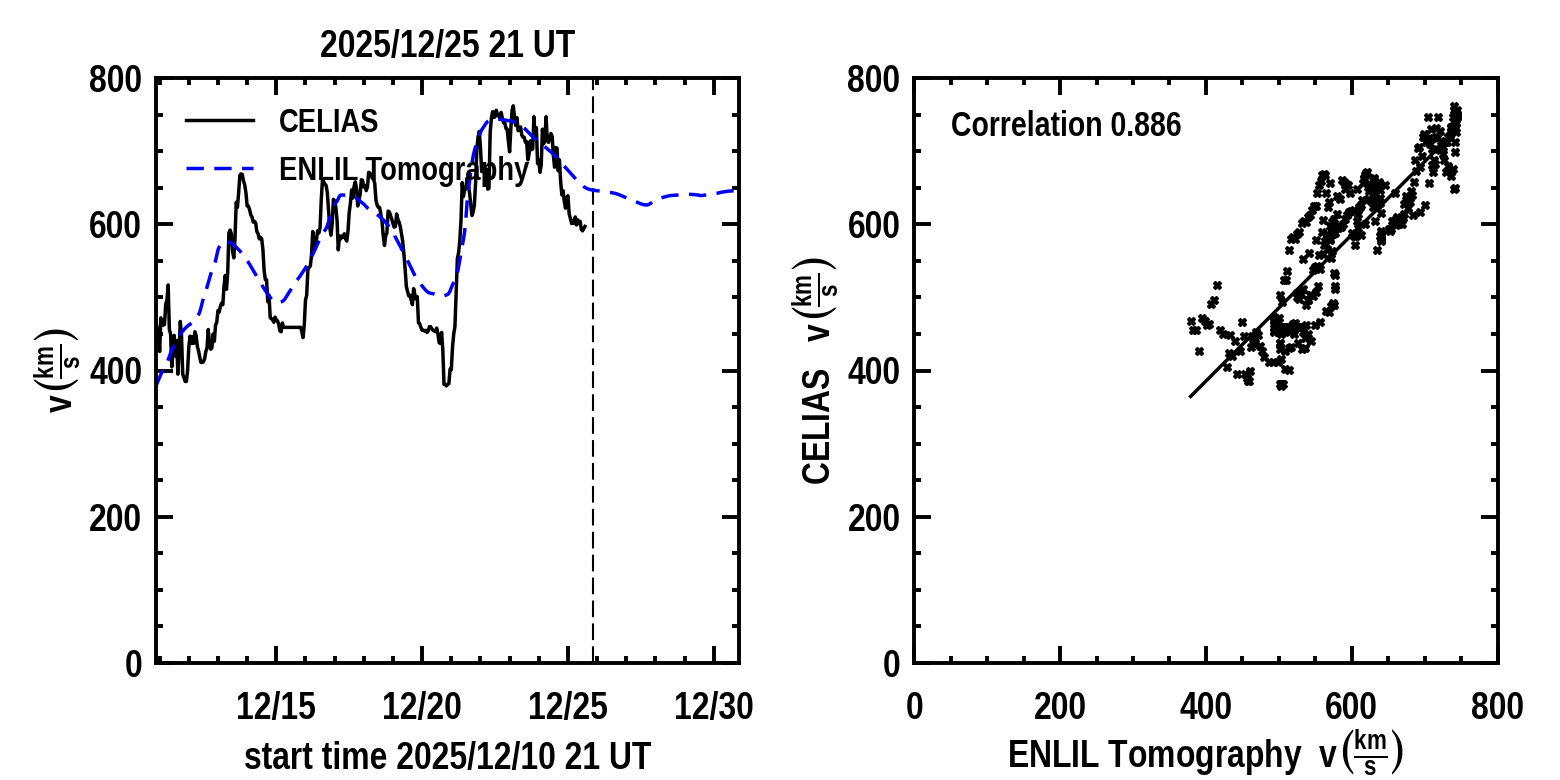
|
ENLIL and Kinematic Model Planar cuts along the ecliptic: These show the density (normalized to 1 AU) and velocity, as planar cuts along the ecliptic within 3 hours of the current time. The first and third ecliptic plots use a converged kinematic model fit to ISEE IPS data that provides a boundary for the ENLIL model. This boundary is provided by the Jupiter kinematic model that is "stabilized" at Earth to some extent by the use of the CELIAS in-situ plasma data. The second and fourth plots show the kinematic model. The Sun is in the center; Earth is shown in its orbit around the Sun to the right in each image. The inner planets, Parker Solar Probe, BepiColombo, and Solar Orbiter locations are shown on the plots. The same is shown on the four plots below, but to the orbit of Jupiter, and Jupiter is also shown on its orbit in the kinematic model.
This analysis is experimental, and will change as we manipulate the ENLIL and the UCSD kinematic model that provides the 21Rs boundaries for ENLIL. The overview ecliptic plots are the same as those shown to the left. The ENLIL time-series compares the IPS-driven model to ACE plasma data from NOAA. The density and velocity in-situ plots provide the same data from ENLIL that is present in the ENLIL overview plot, but these are compared with CELIAS density and velocity measurements plotted with a one-day and one-hour cadence, and as the kinematic model compared using a Pearson's R correlation.