|
Radial Magnetic Field Mercury 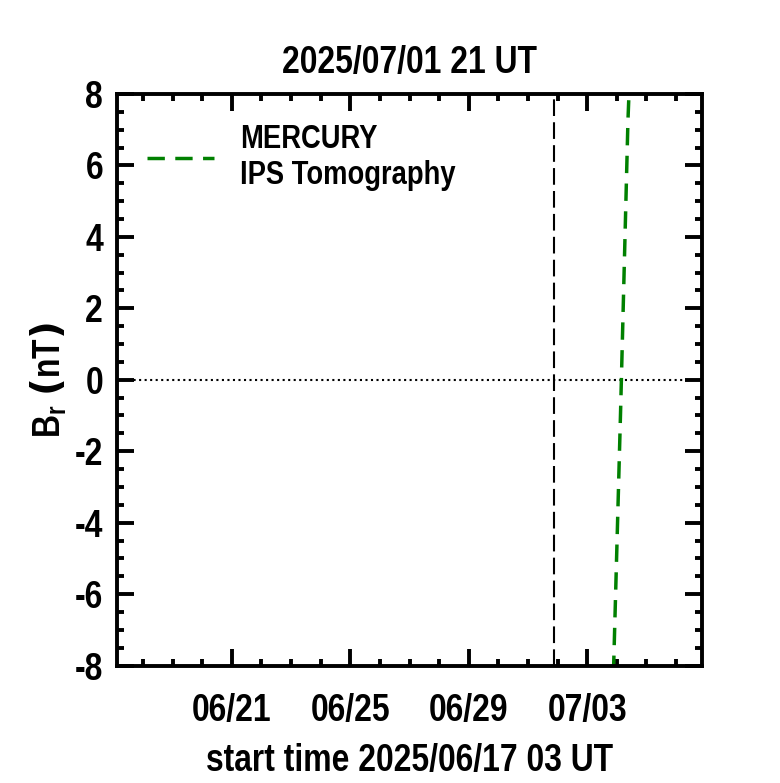
BepiColombo 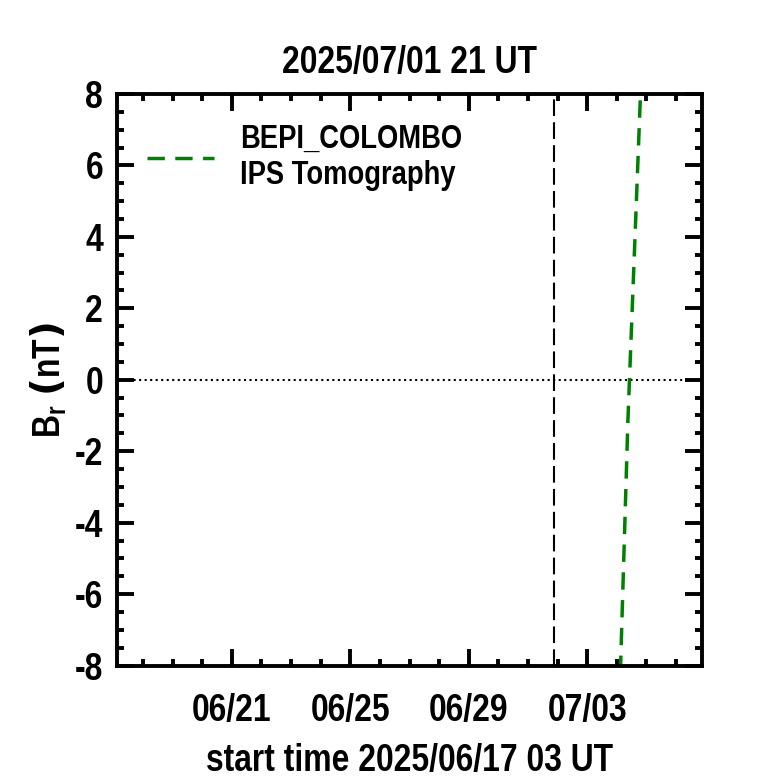
Venus 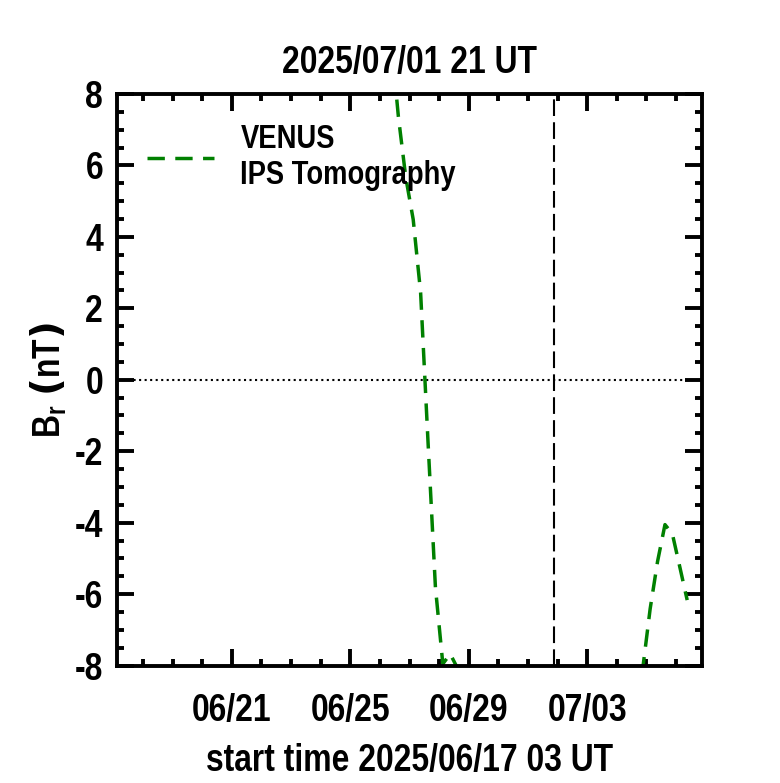
PSP 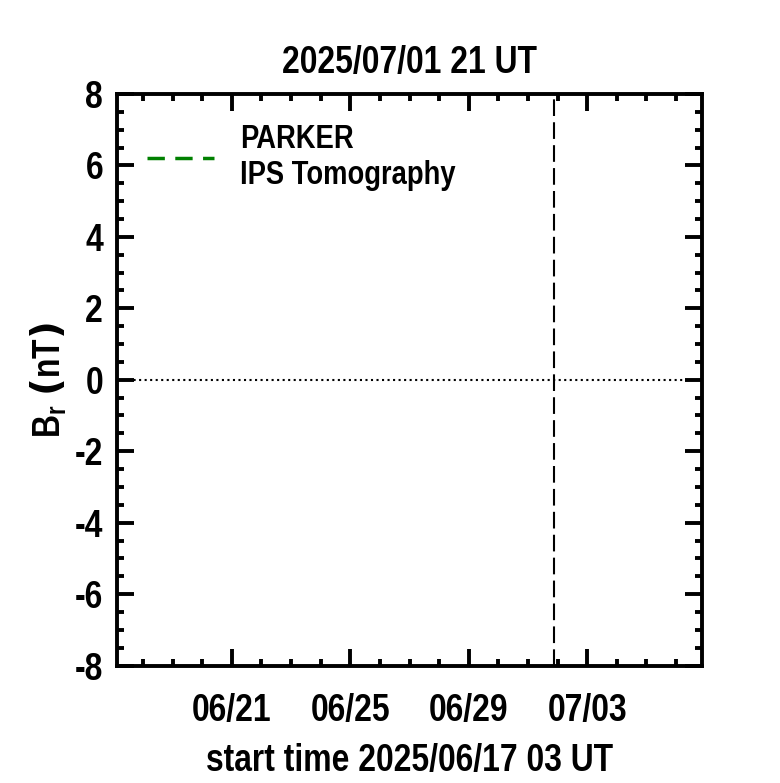
Mars 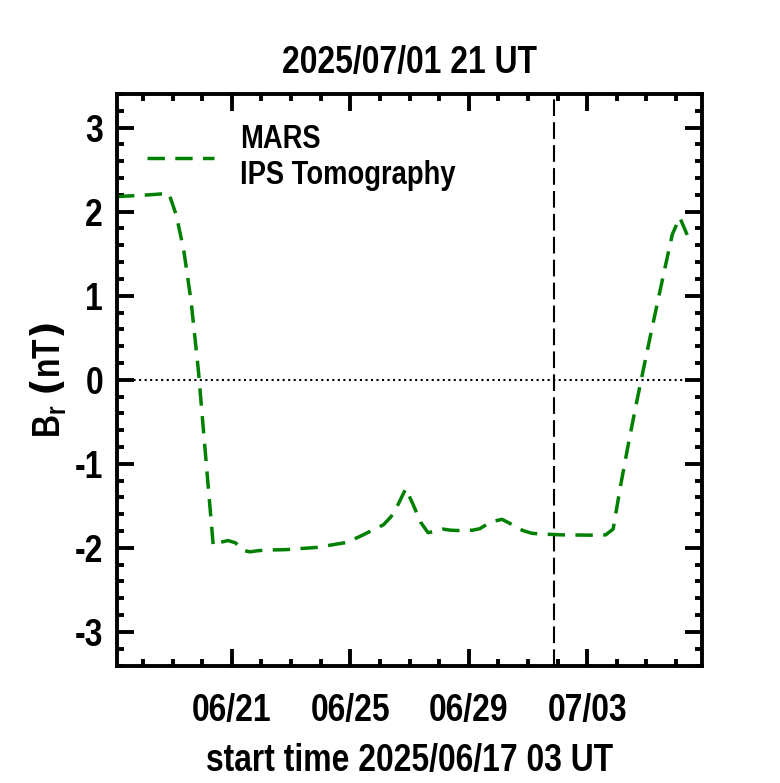
Orbiter 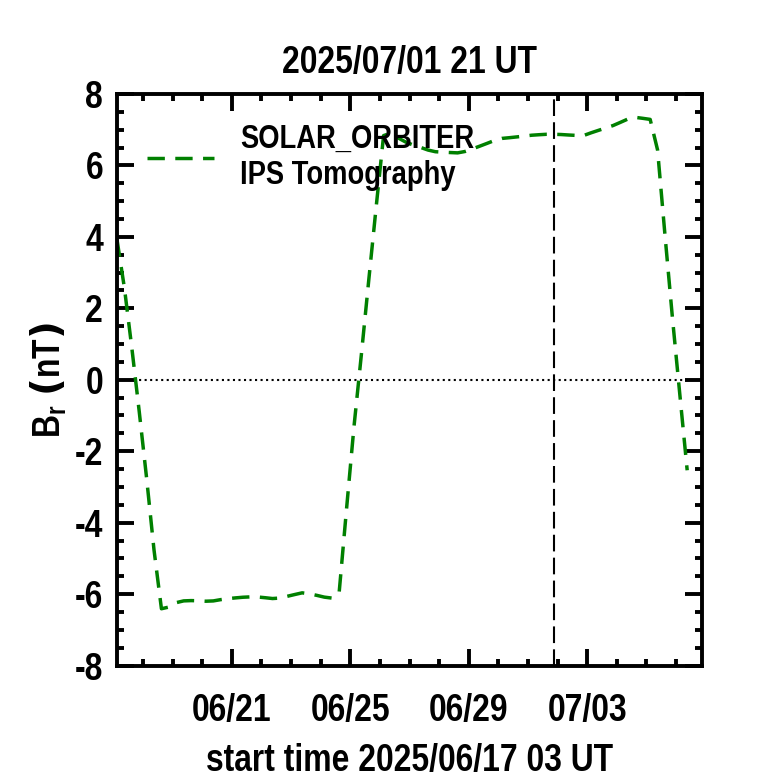
Earth 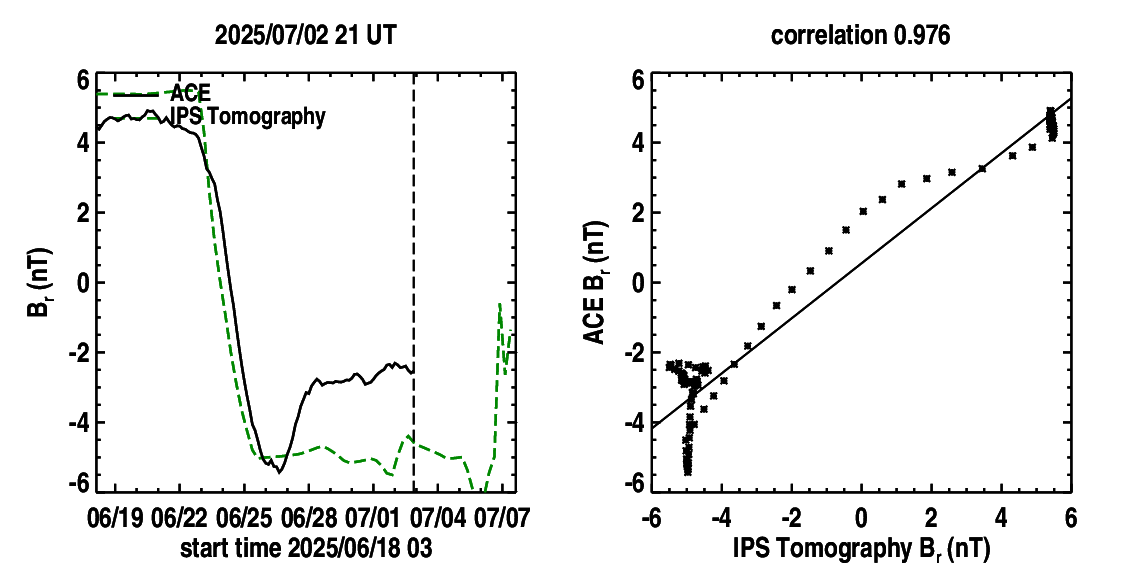
Stereo 1 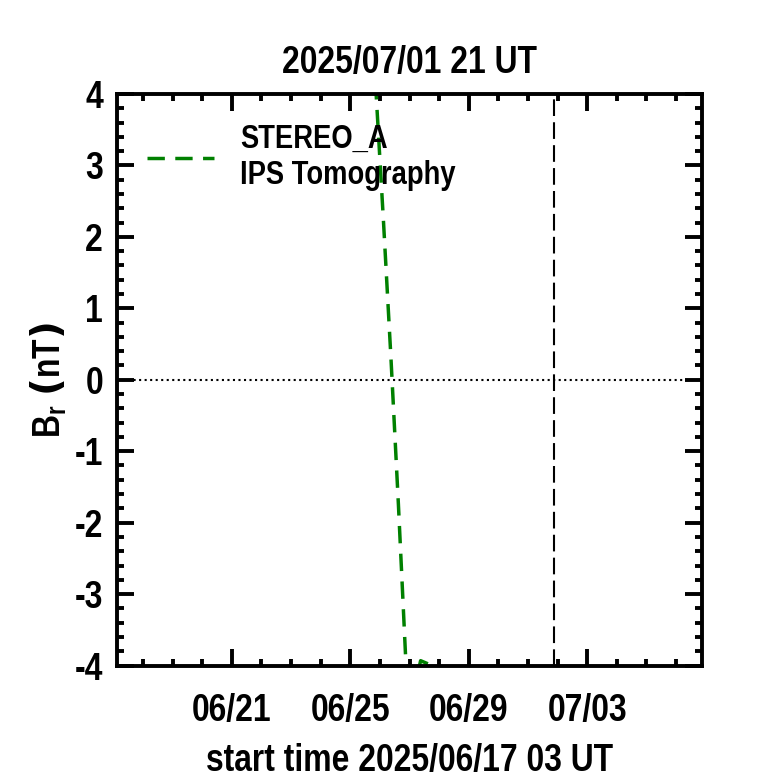
|
This is a Kinematic Model run of the ISEE, Japan Interplanetary Scintillation (IPS) analysis showing radial and tangential magnetic field (in RTN coordinates) and the detail of the orbits of the inner planets that also includes the spacecraft Parker Solar Probe, BepiColombo, and Solar Orbiter. These fields are derived from outward projections of the Global Oscillation Network Group (GONG) solar surface fields updated several times each day using the CSSS (Zhao and Hoeksema, 1995, J.Geophys. Res., 100 (A1), 19-33) model, and then extrapolated outward from 15 Rs using IPS derived velocities. More imagery of these same real-time data that are Earth-based and at somewhat different resolution can be found from this same left page or at: http://ips.ucsd.edu/IPS-ENLIL_predictions or http://ips.ucsd.edu/ENLIL_predictions.
|
Radial Magnetic Field Mercury
BepiColombo
Venus
PSP
Mars
Orbiter
Earth
Stereo 1
|
|
Tangential Magnetic Field Mercury 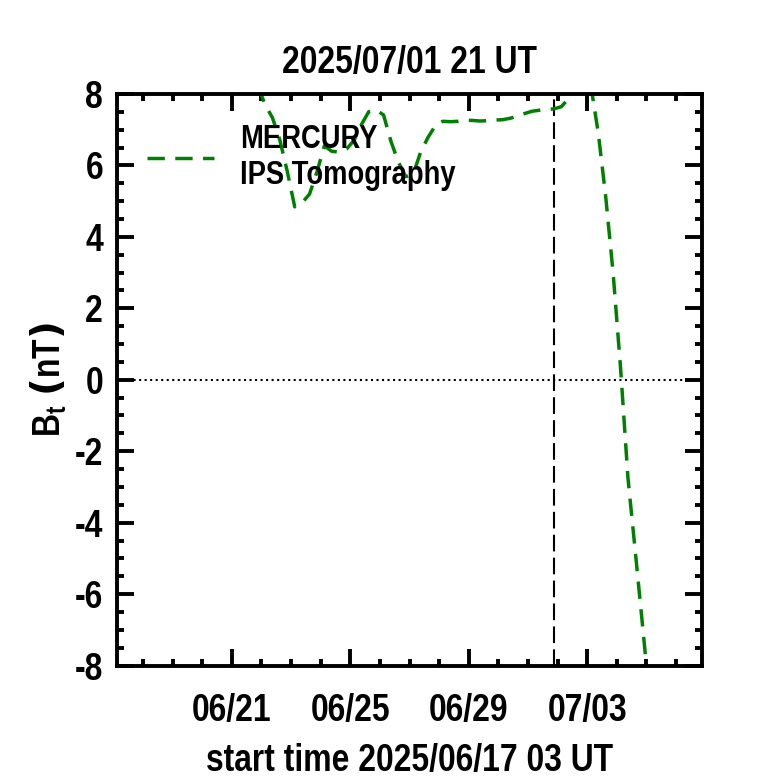
BepiColombo 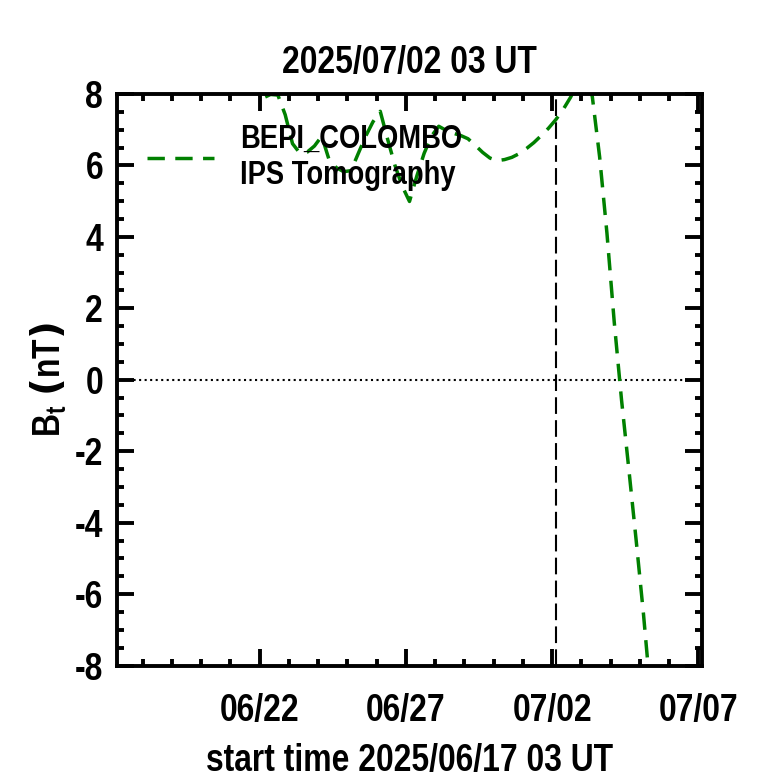
Venus 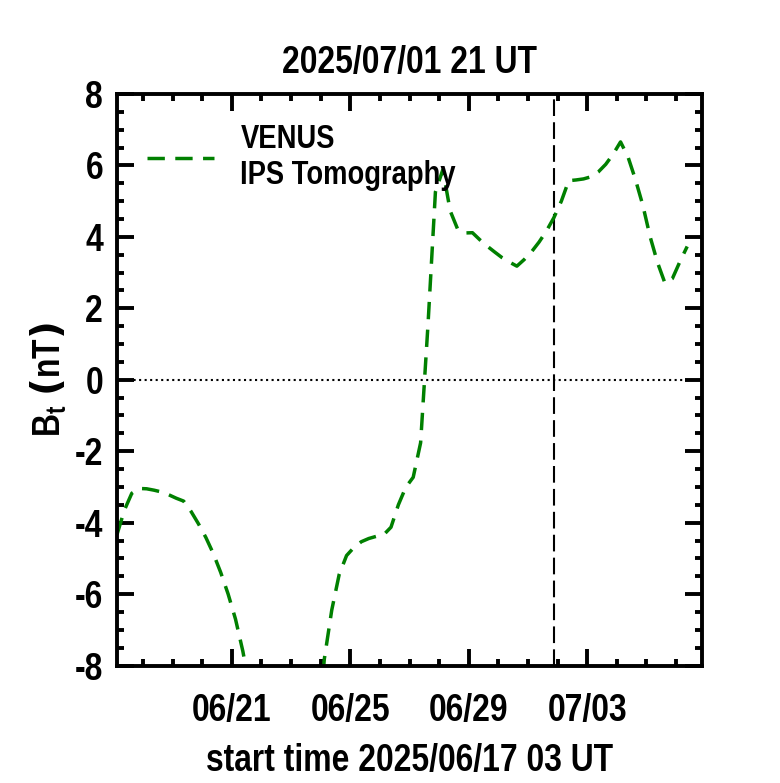
PSP 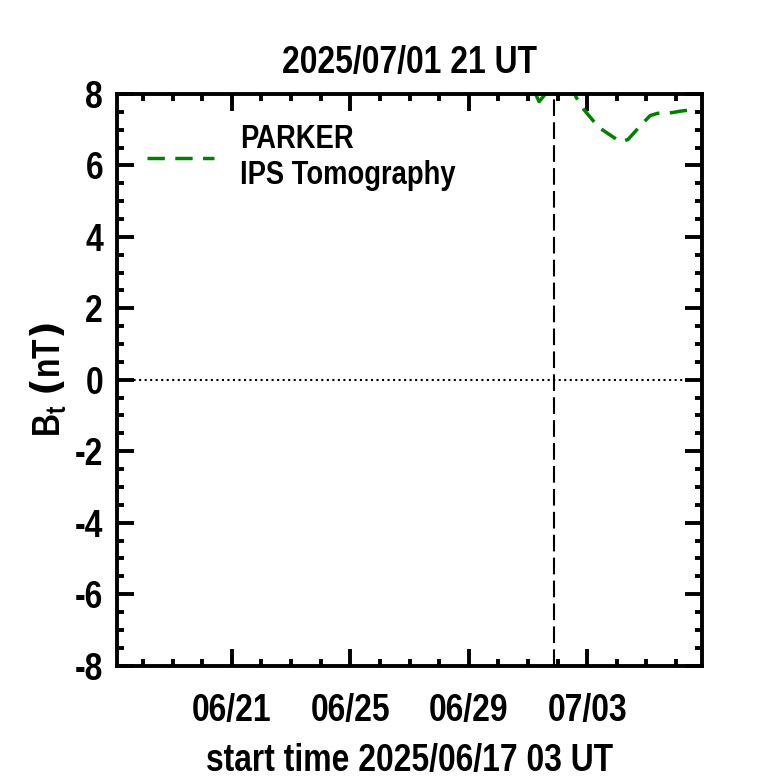
Mars 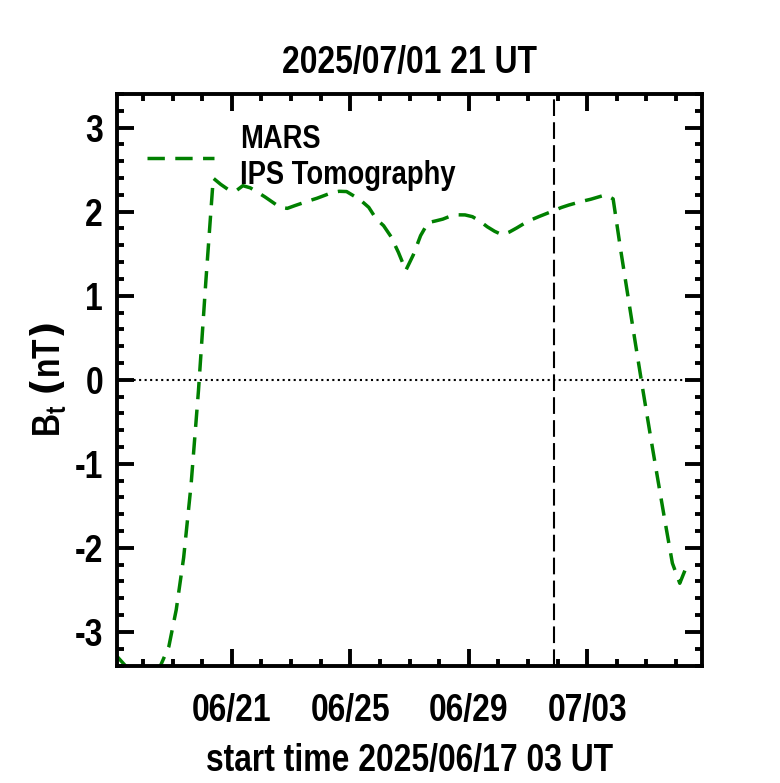
Orbiter 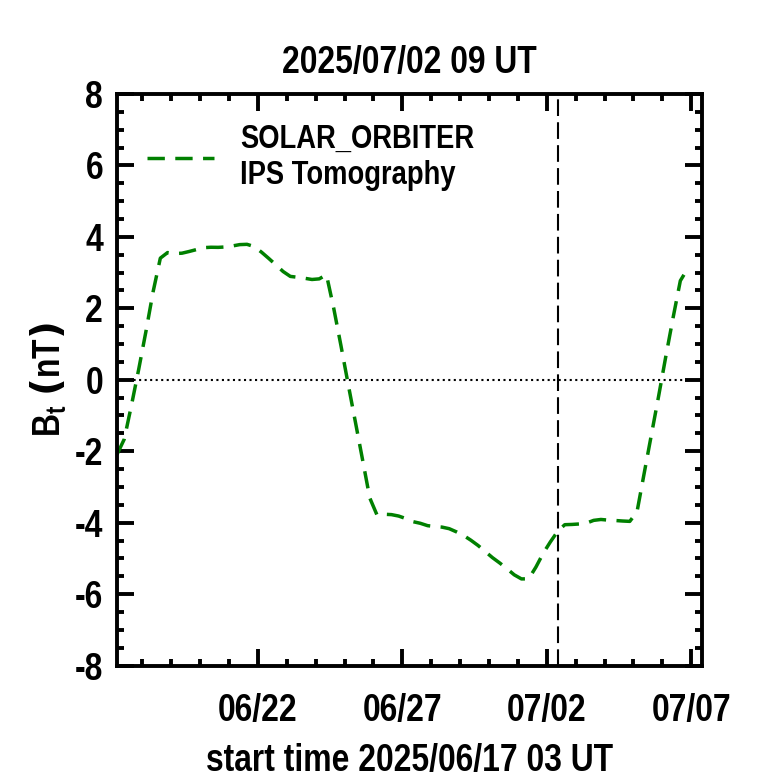
Earth 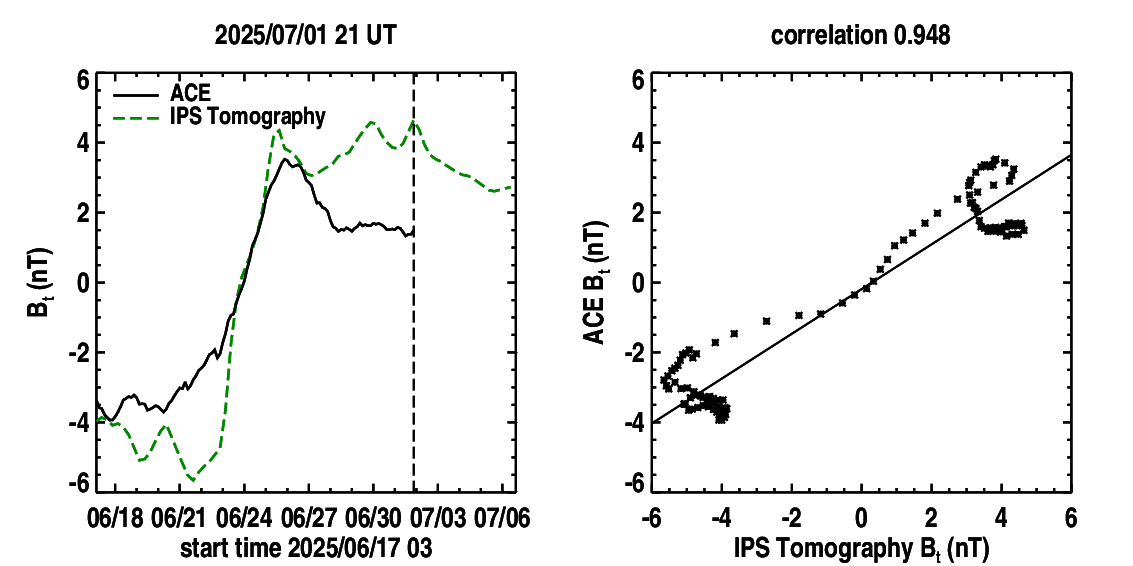
Stereo 1 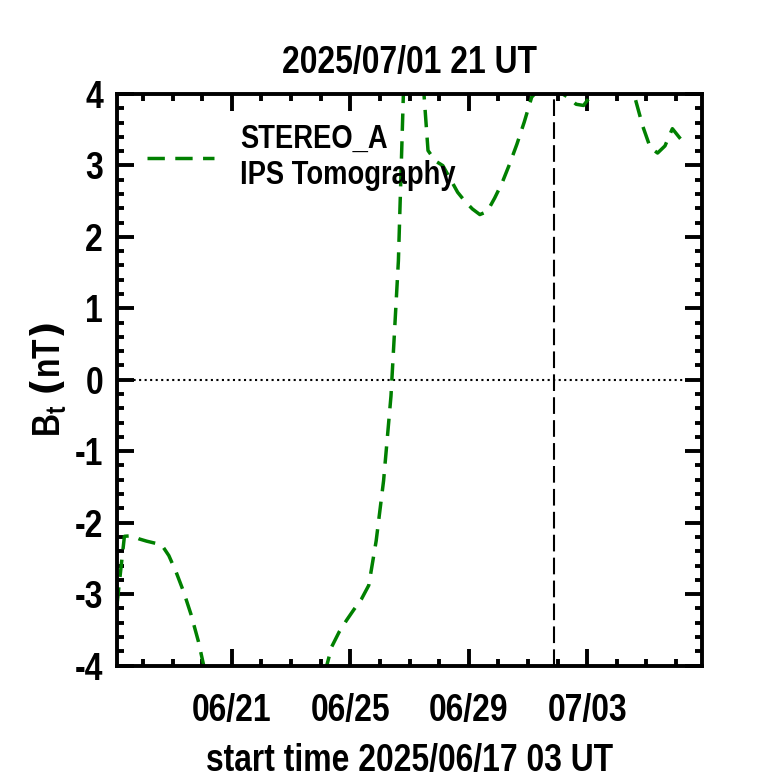
|
Planar cuts along the ecliptic: These show the radial and tangential magnetic field (normalized to 1 AU) as planar cuts along the ecliptic within 6 hours of the current time. The Sun is in the center with Earth to the right; The planets Mercury, Venus, Earth, and Mars are shown on their orbits around the Sun projected into the ecliptic plane. The Parker Solar Probe, BepiColombo, and Solar Orbiter are shown as the indicated symbols. The maps are derived from a tomographic time-dependent model of the solar wind that is fit to interplanetary scintillation (IPS) velocities and g-levels obtained daily from ISEE, Japan. The model is updated every six hours.
Planar cuts at the Earth's meridian: These show the radial and tangential magnetic field (normalized to 1 AU) as planar cuts along at the Earth's meridian at the same time as the ecliptic cuts. The Sun is in the center; Earth is shown on its orbit (a straight line) to the right of the image. The planets Mercury, Venus, and Mars are shown as small circles. The Parker Solar Probe, BepiColombo, and Solar Orbiter are shown as the indicated symbols.
Time series plots: Planetary and spacecraft solar wind parameters of radial (Br) and tangential (Bt) magnetic fields are derived from the time-dependent tomography model (dashed curves) and presented here in real time. A vertical dashed line indicates the GMT run time of the tomography program that is provided above the time series. The time series is updated every six hours at the same time as the volumetric cuts. The prediction of future parameter values begins at the location of the vertical dashed line. Near-Earth solar wind parameters (dashed curves) are shown in comparison with Advanced Composition Explorer (ACE) spacecraft Br and Bt measured values (solid curves). For Earth the Pearson's "R" correlation between the model and measured values of the Br and Bt are shown up to the time there are no more in-situ spacecraft data available.