Remote Observer Views
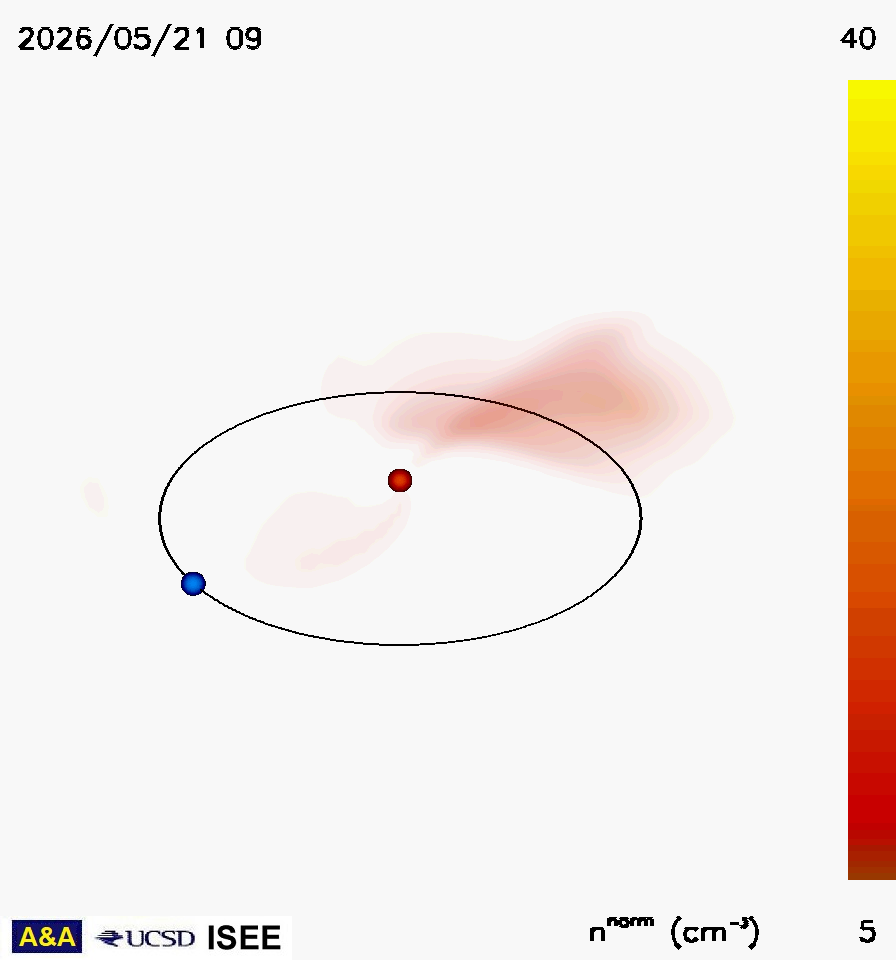
Density
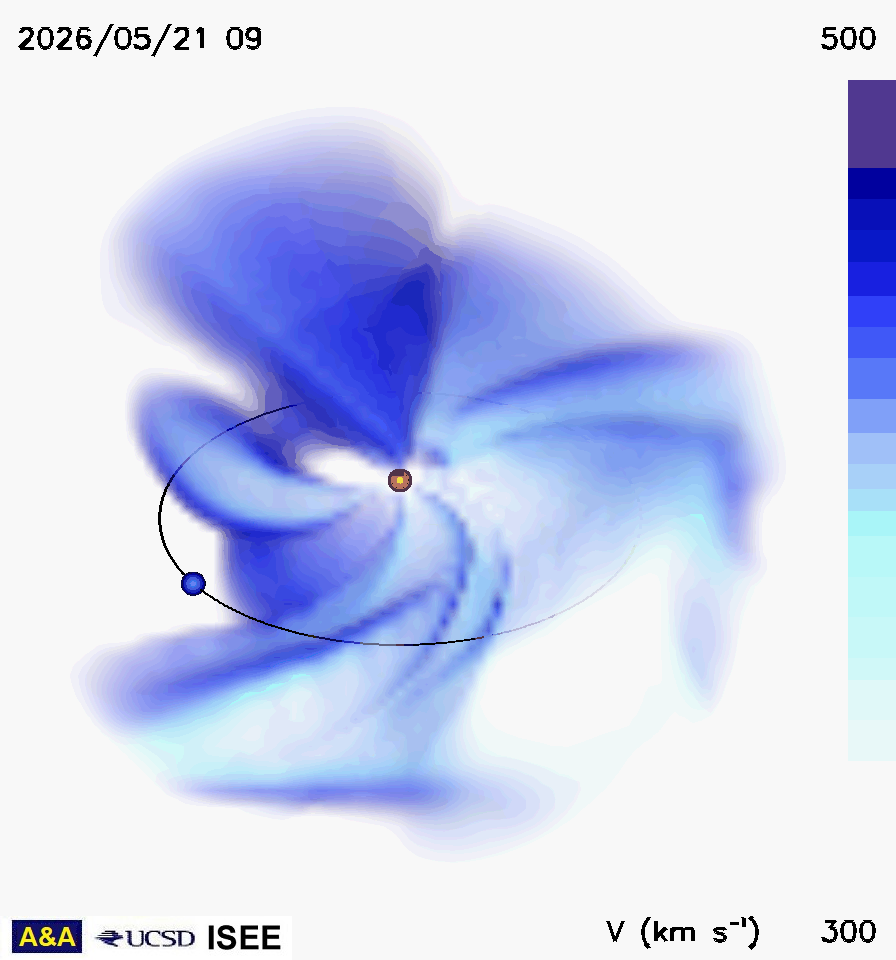
Radial Velocity

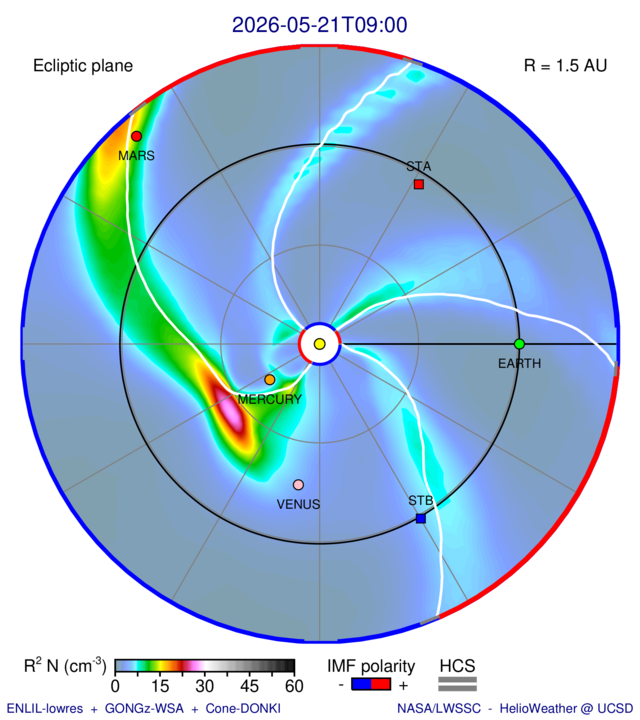
This is the zeroth iteration that begins the iterative ENLIL procedure, see: http://ips.ucsd.edu/ENLIL_predictions; the 3-D volumes are interpolated at 21.5 Rs (0.1 AU) for ENLIL. The analysis is refreshed four times daily and presented at 03UT, 09UT, 15UT, and 21UT. A nearly identical high-resolution kinematic model version run on the main server computer is found at this subheading and at: http://ips.ucsd.edu/high_resolution_predictions. A similar system to this modeling where the IPS kinematic model is used to drive ENLIL is run at George Mason University, and at the Korean Space Weather Center (KSWC). Updates to this modeling are ongoing.
|
Remote Observer Views
|
|
Density
|
|
Radial Velocity
|
Kinematic Model Remote views: of the density and radial velocity as an observer would view the heliosphere from a position 30 deg above the ecliptic plane and 45 degrees west of the Sun-Earth line. The orange dot in the center is the Sun, and the Earth is shown as a blue sphere on its orbit. Densities are normalized to 1 AU.
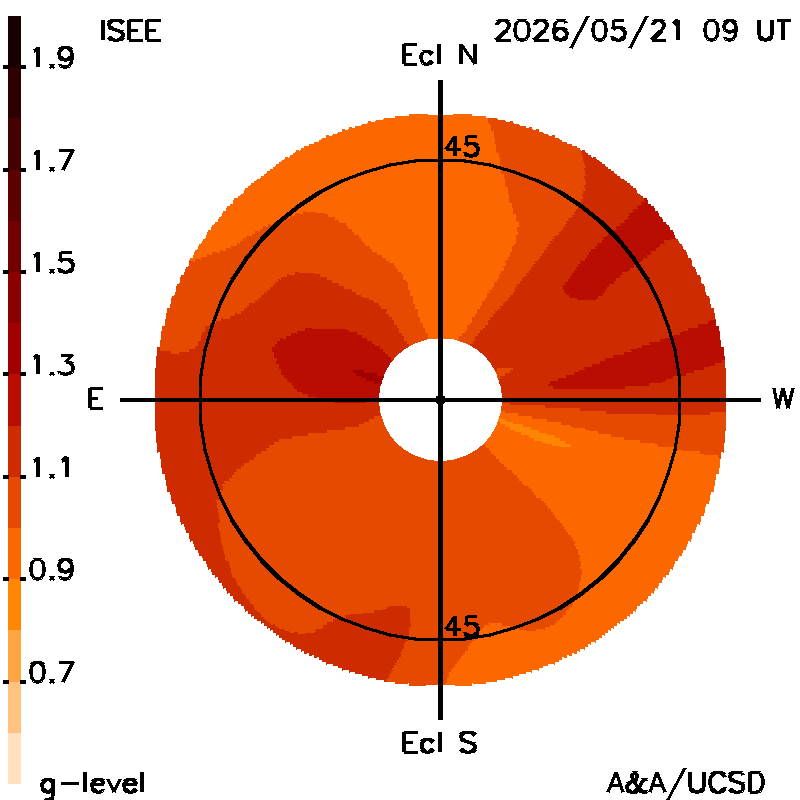
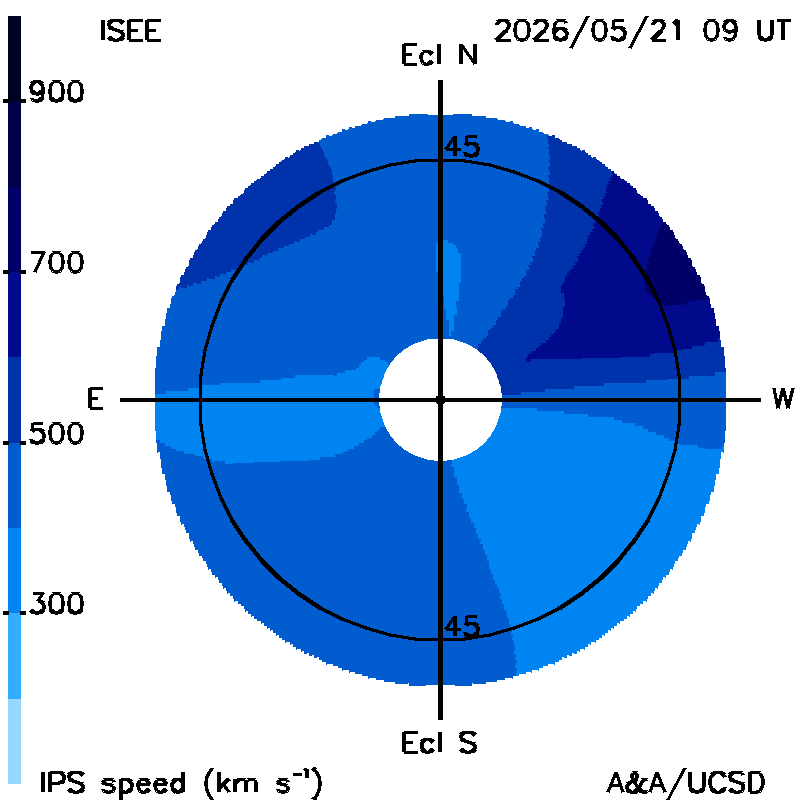
Kinematic Model Fisheye views: views of g-level and radial velocity perpendicular to the line of sight as an observer would view the sky from Earth. The Sun is in the center of the plot, that extends to ~55 deg elongation away from it (the blank location at the plot center extends to 11.5 deg, the outward extent of strong scattering from the Sun; 45 deg is marked). The ecliptic is shown as a horizontal straight line.
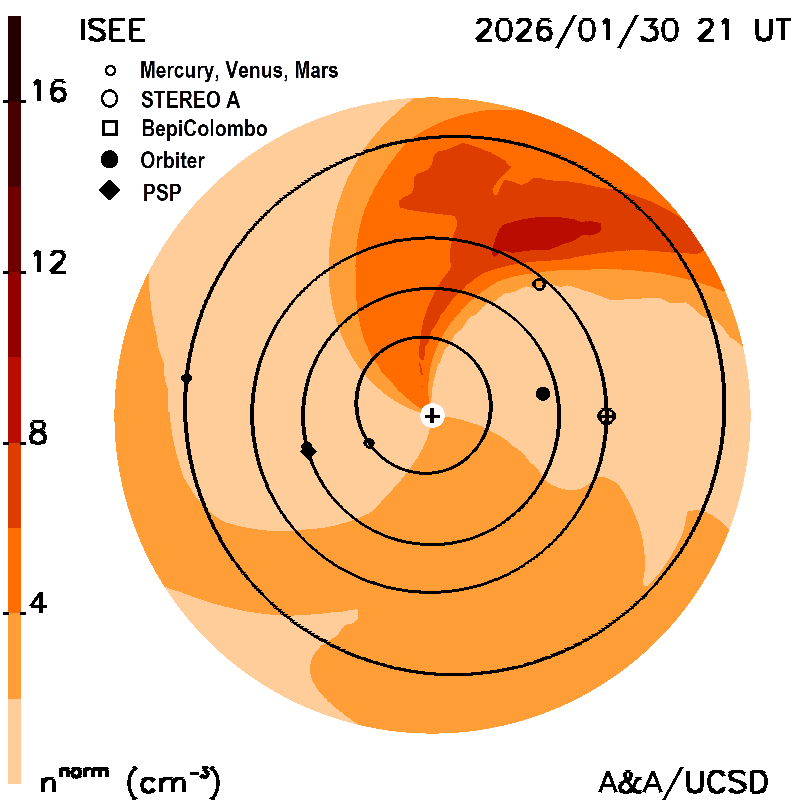
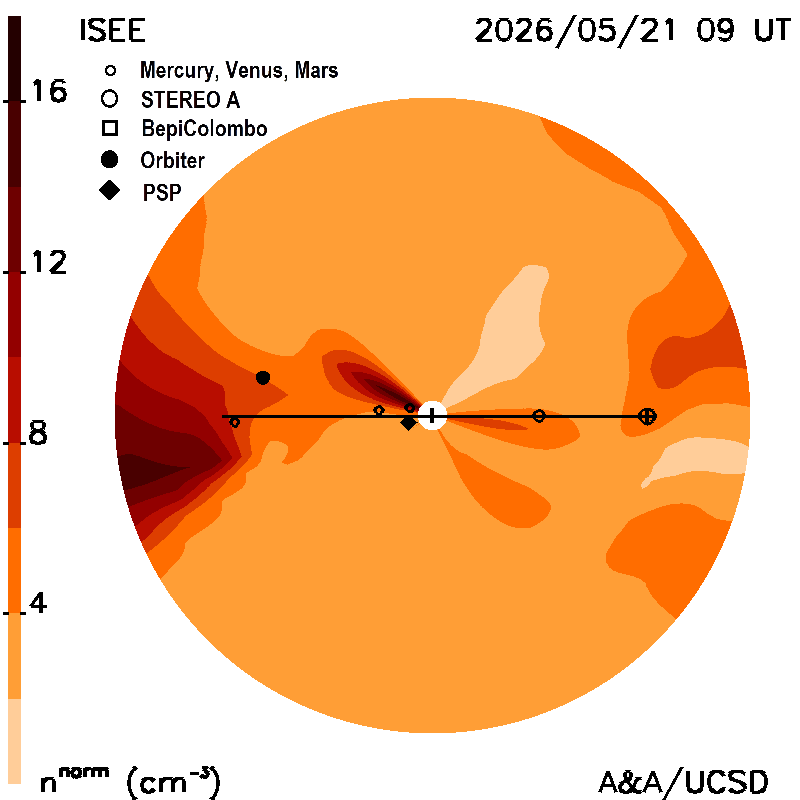
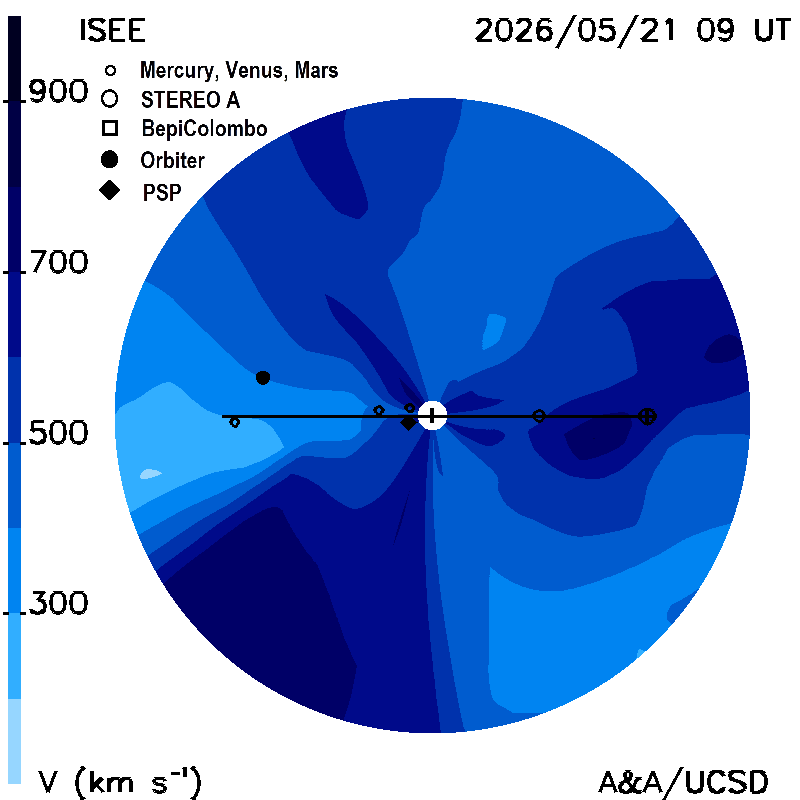
ENLIL and Kinematic Model Planar Cuts along the ecliptic: These show the density (normalized to 1 AU) and velocity, as planar cuts along the ecliptic within 6 hours of the current time. The first ecliptic plot uses converged kinematic model that is the zeroth iteration ENLIL fit to IPS data, the second, the same data that was used to provide the ENLIL zeroth iteration. The Sun is in the center; Earth is shown in its orbit around the Sun. The maps are derived from a tomographic time-dependent model of the solar wind with an ENLIL kernel that is fit to interplanetary scintillation (IPS) velocities and g-levels obtained daily from ISEE, Japan. The model is updated four times daily.
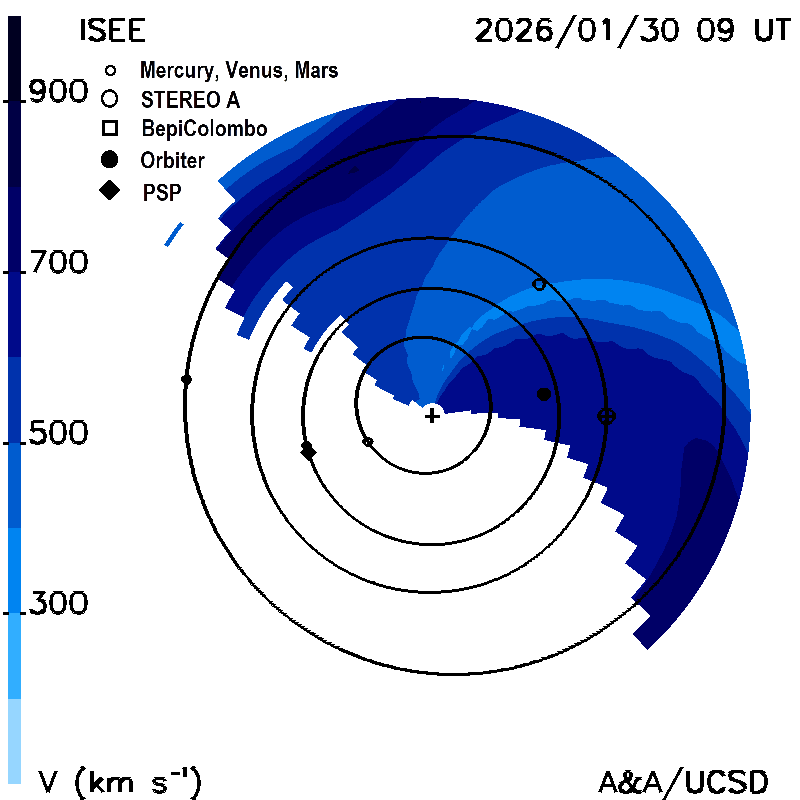
ENLIL and Kinematic Model Planar Cuts at the Earth's meridian: Planar cuts at the Earth's meridian: These show the density (normalized to 1 AU) and velocity as planar cuts along at the Earth's meridian in the same manner and time as the ecliptic cuts. The Sun is in the center; Earth is shown on its orbit (a straight line) to the right of the image.
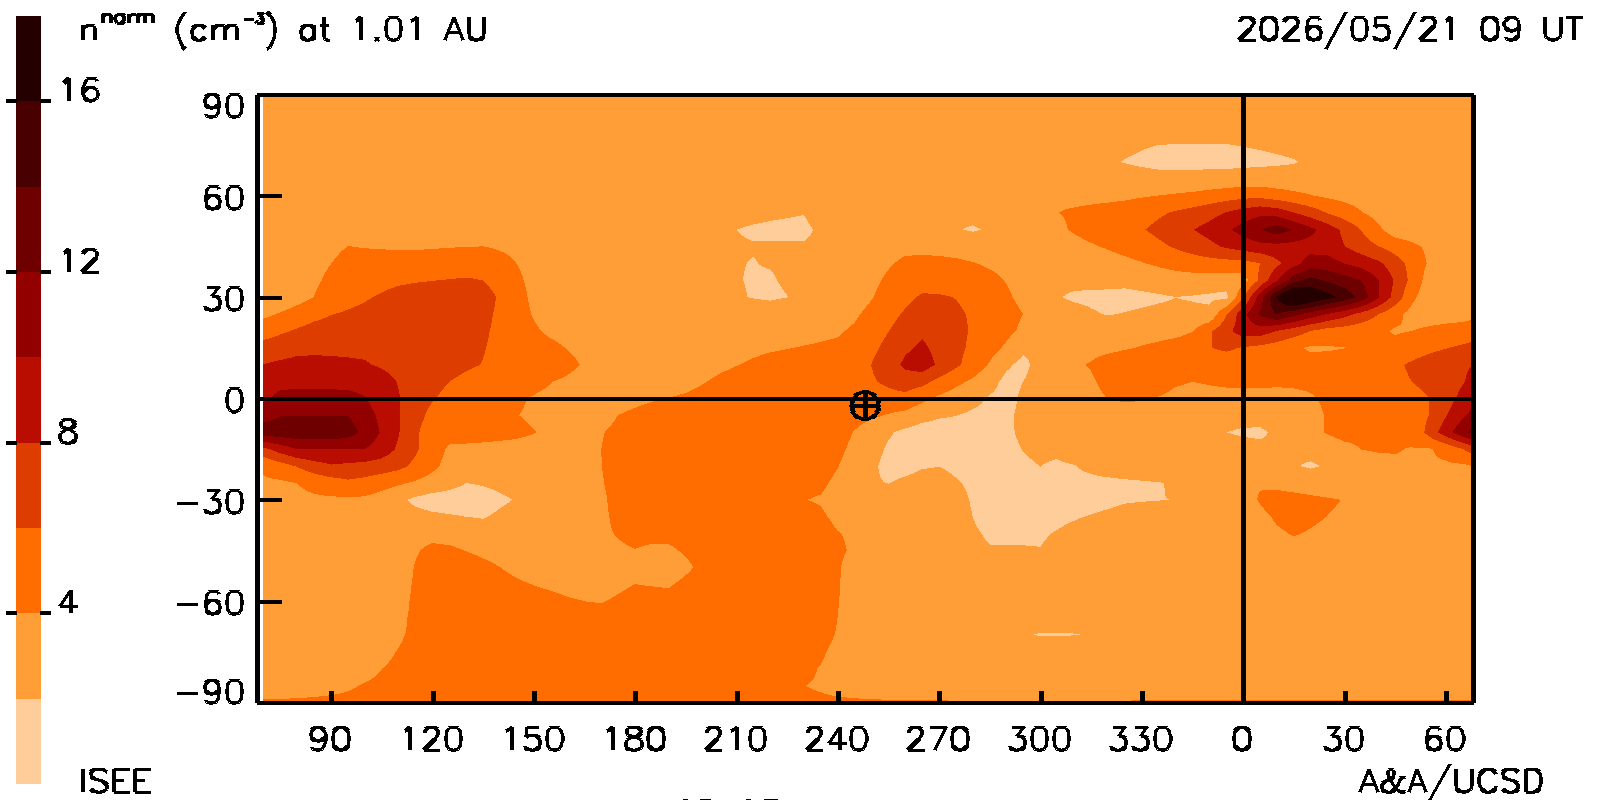
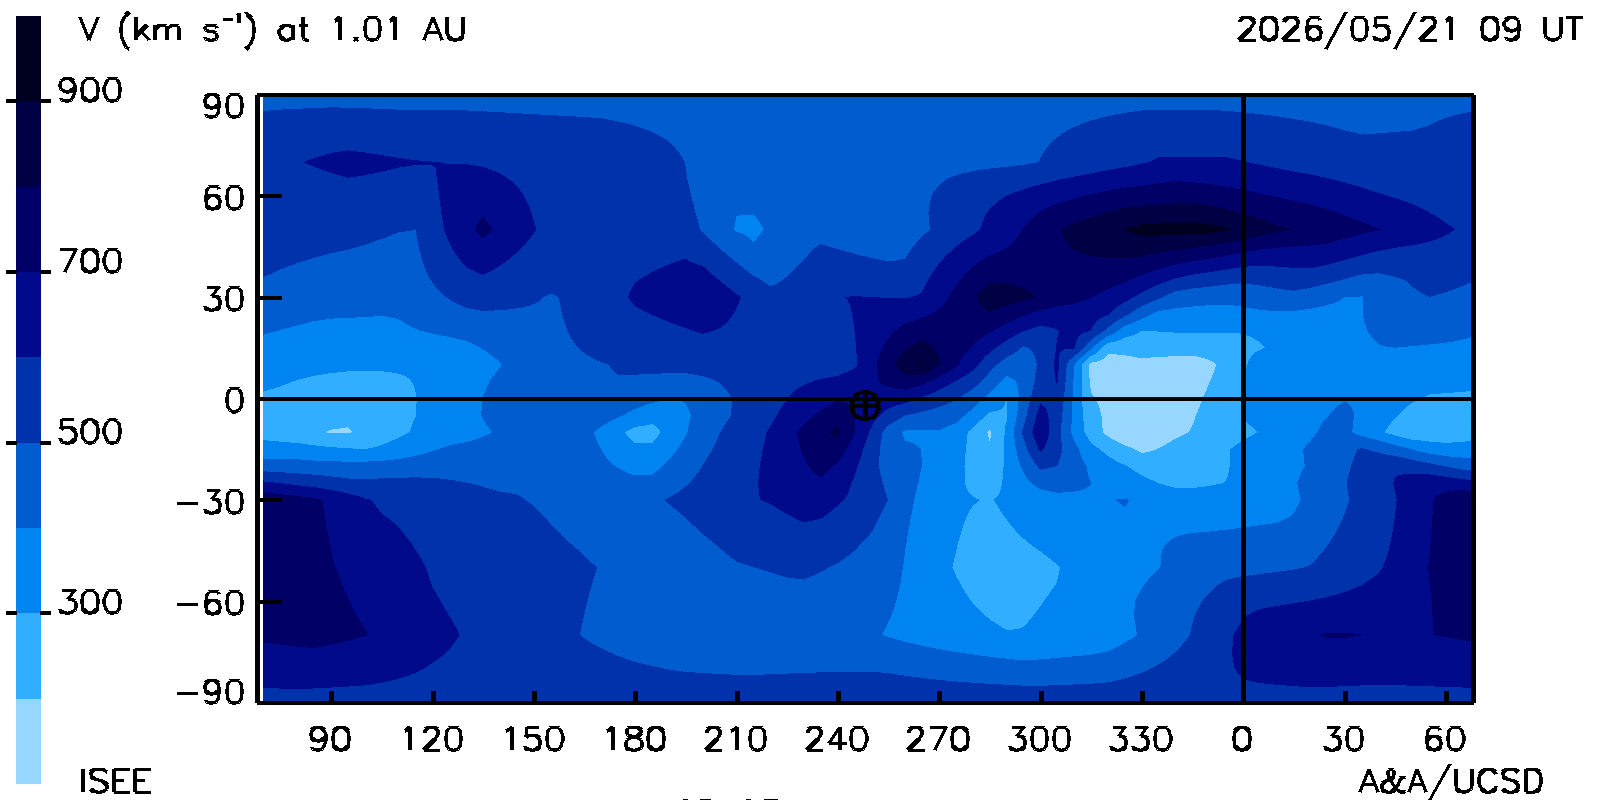
Kinematic Model Carrington maps: Heliographic latitude and longitudinal maps of density and velocity around the Earth at its distance from the Sun at the same time as the ecliptic and meridional cuts. The Earth is shown near the center of the plot.
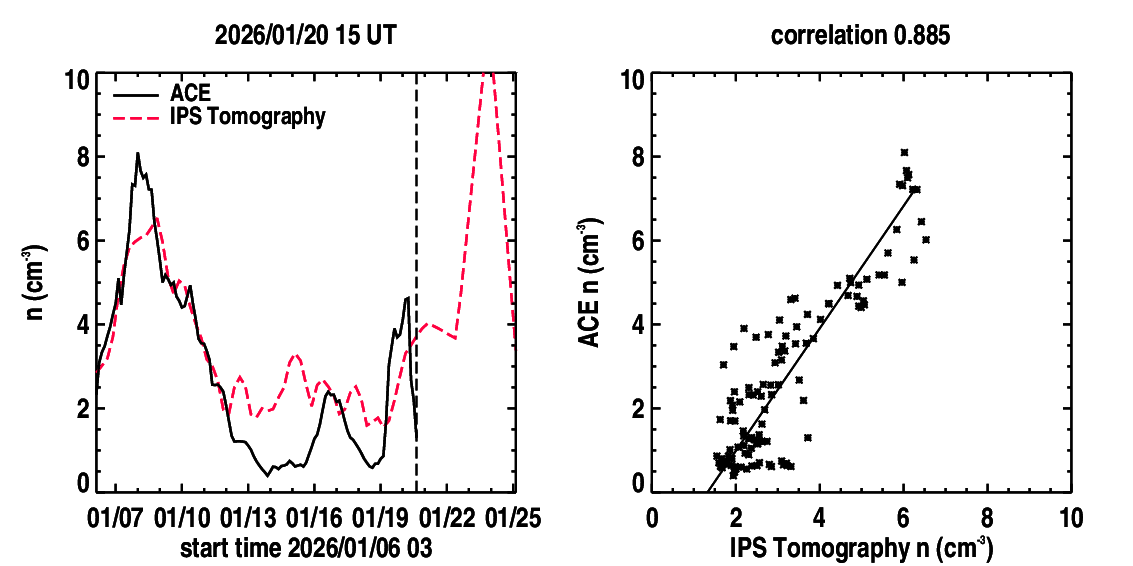
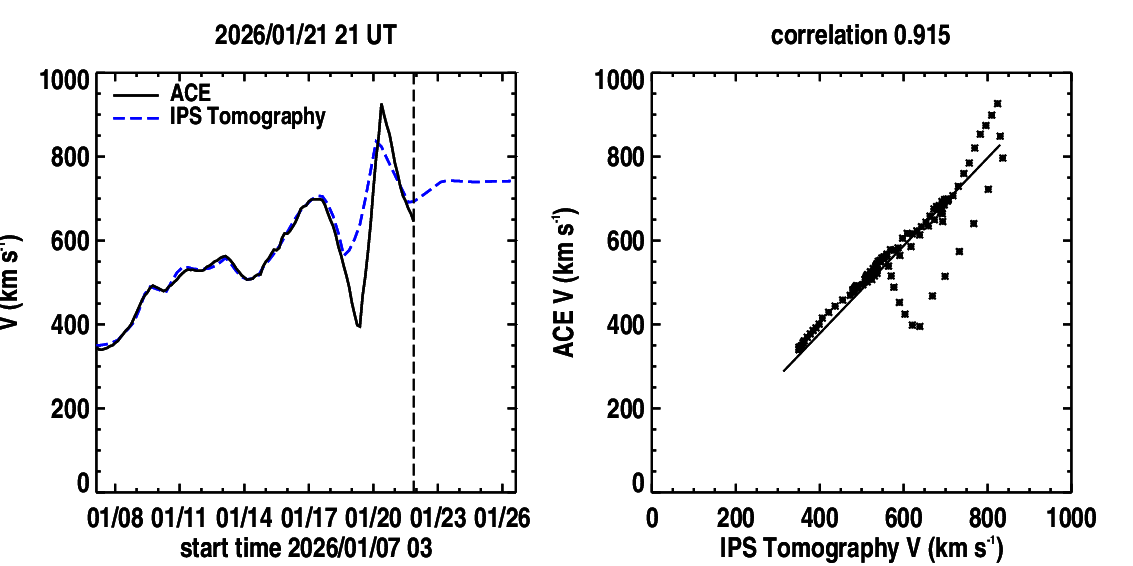
Kinematic Model Time series plots: Near-Earth solar wind parameters density and radial velocity derived from the time-dependent tomography model (dashed curves) shown in comparison with velocity and density(solid curves) provided by NOAA. A vertical dashed line indicates the GMT run time of the tomography program that is provided above the time series. The Pearson's "R" correlation between the model and observed values of each parameter are shown up to the time there are no more spacecraft data available. The time series is updated four times daily and presented at the same time as the volumetric cuts. The prediction of the future parameter values begins at the location of the vertical dashed line where the observed values end.