|
Radial Velocity 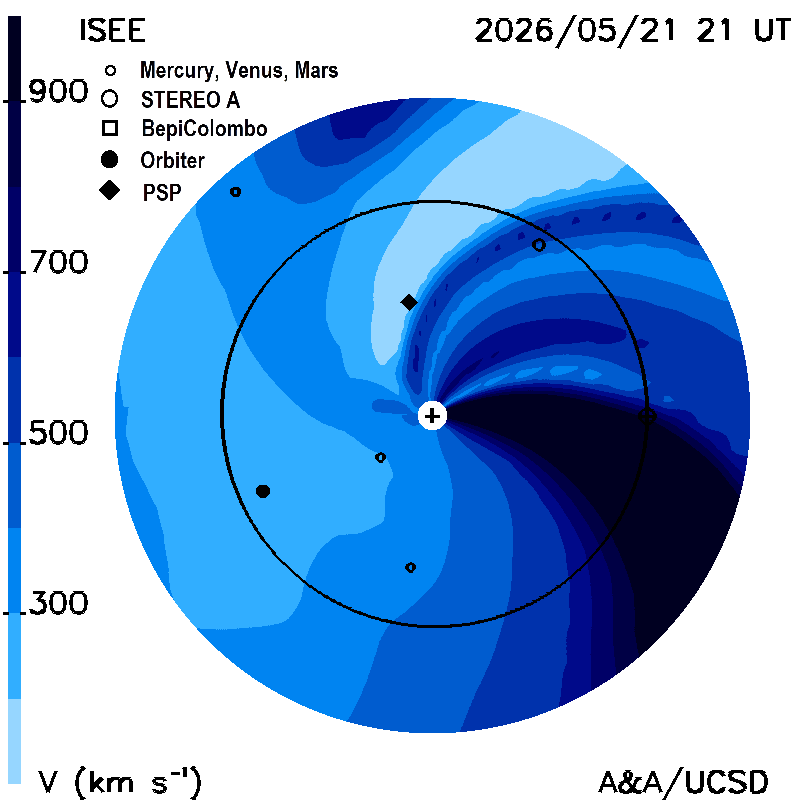
|
Volumetric cuts:
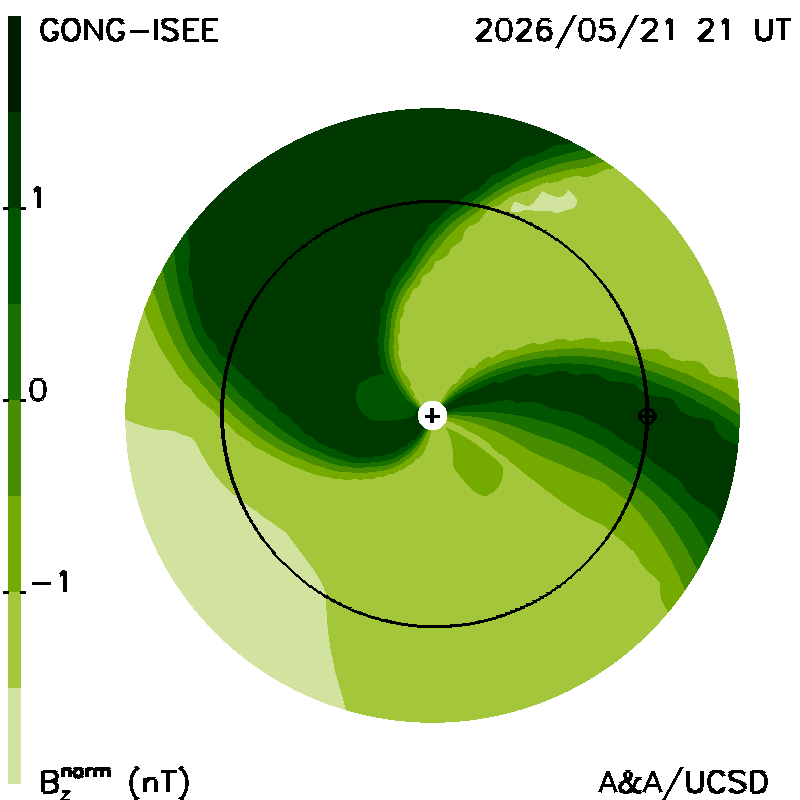
Kinematic Model Planar Cuts along the ecliptic: These show "extended" GSM Bz fields (normalized to 1 AU), and solar wind radial velocities as planar cuts along the ecliptic within 6 hours of the current time. Magnetic fields are extrapolated upward from the solar surface. The Sun is in the center; Earth is shown in its orbit around the Sun. The maps are derived from a tomographic time-dependent model of the solar wind used at 21.5 Rs (0.1 AU) to provide IPS-driven boundaries for the zeroth-iteration iterative ENLIL model using interplanetary scintillation (IPS) velocities and g-levels obtained daily from ISEE, Japan. The model is updated four times daily.
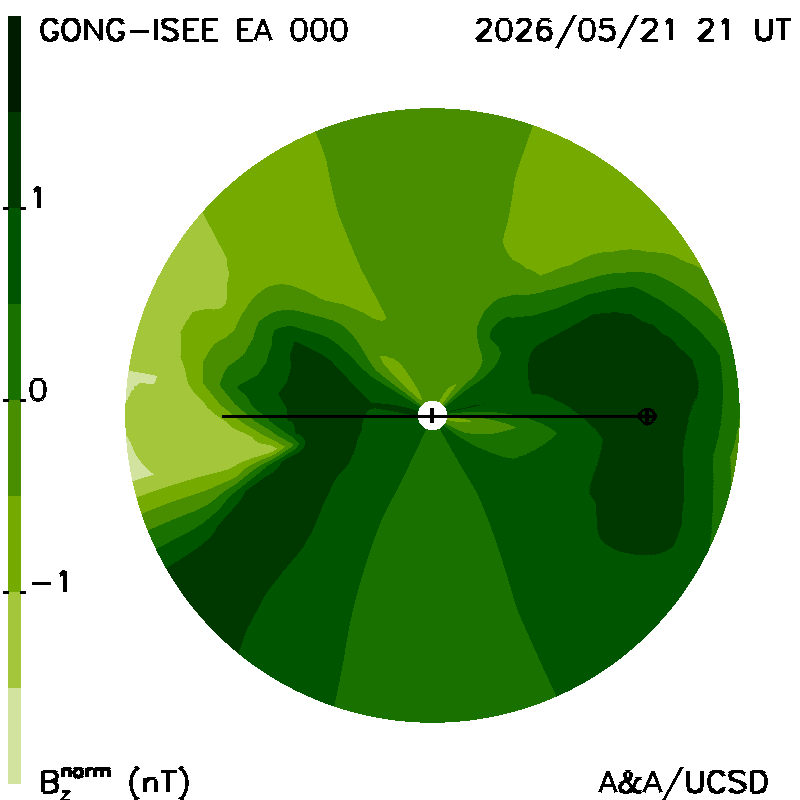
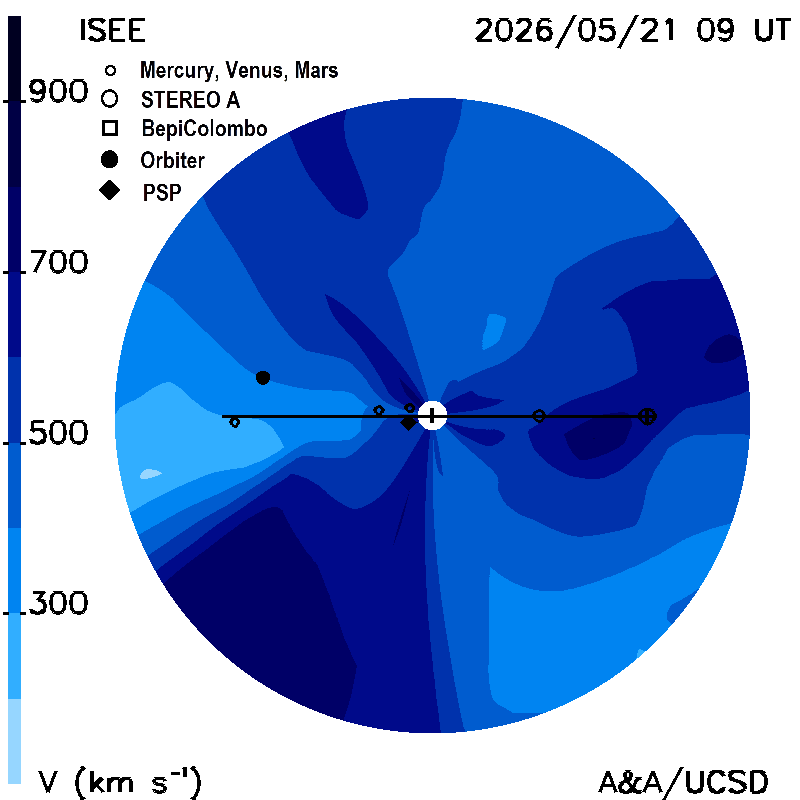
Kinematic Model Planar Cuts at the Earth's meridian: These show "extended" GSM Bz fields (normalized to 1 AU), and solar wind radial velocities as north-south planar cuts at the Earth's meridian at the same time as the ecliptic cut. The Sun is in the center; Earth is shown on its orbit to the right of the image.
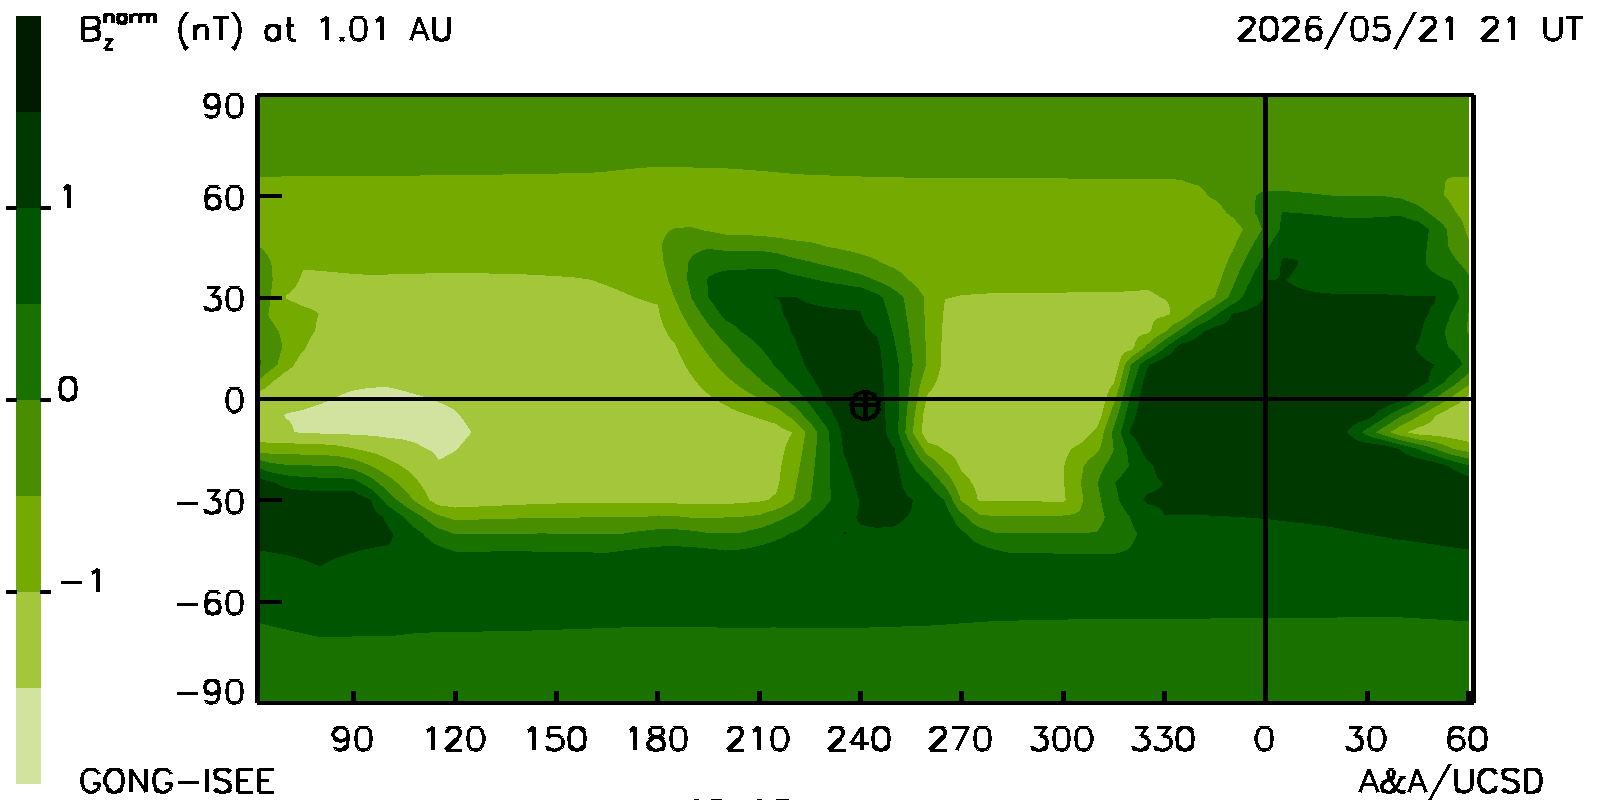
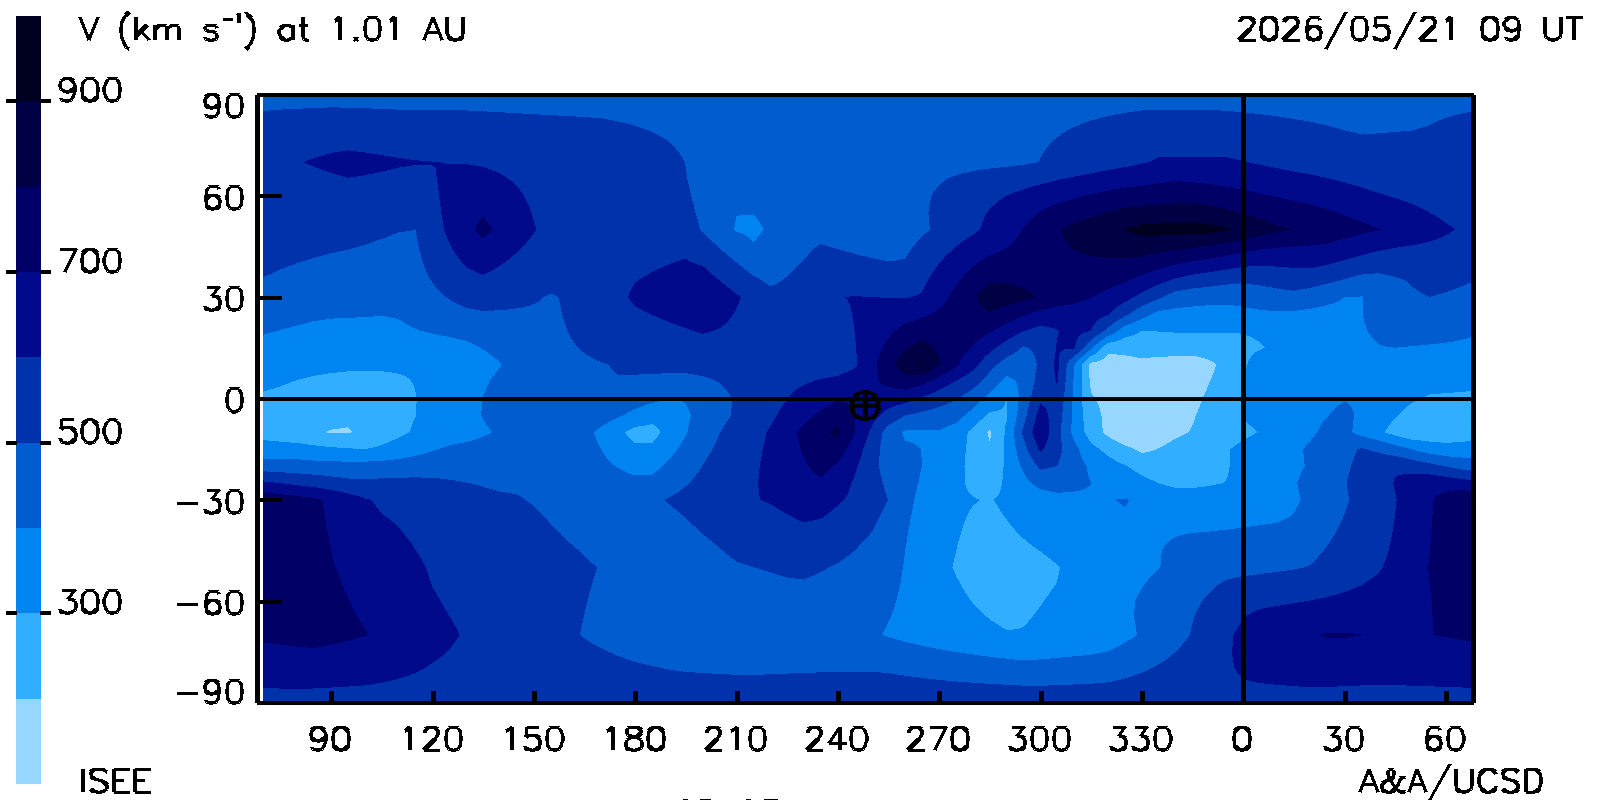
Kinematic Model Carrington maps: "Extended" GSM Bz fields, and solar wind radial velocities surrounding the Earth at its distance from the Sun at the same time as the ecliptic and meridional cuts. The Earth is shown near the center of the plot.
Time Series and Correlations:
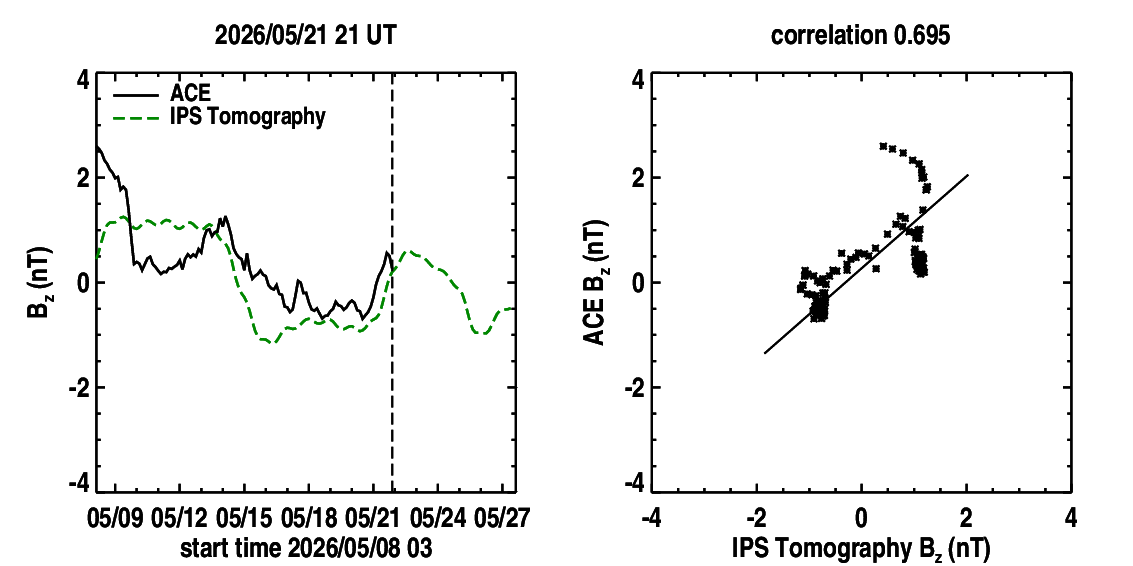
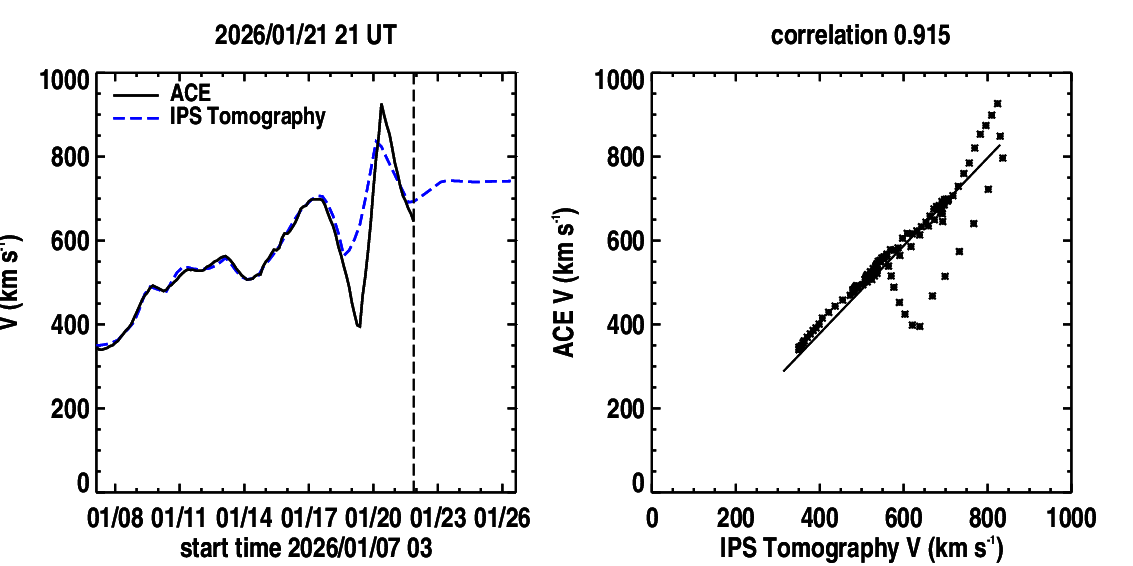
Kinematic model time series plots: Near-Earth solar wind magnetic field parameters of Bz (in GSM coordinates with daily smoothing to eliminate diurnal variations) and radial solar wind velocities from the time-dependent tomography model (dashed curves). These are shown in comparison with Bz component magnetic field data (solid curves) and ACE solar wind speeds provided by NOAA. A vertical dashed line indicates the GMT run time of the tomography program that is provided above the time series. The Pearson's "R" correlation between the model and observed values of each parameter are shown up to the time there are no more spacecraft data available. The time series is updated four times daily and presented at the same time as the volumetric cuts. The prediction of the future parameter values begins at the location of the vertical dashed line where the observed values end. Look for a significant correlation of enhanced Kp values or decreased Dst values when the Bz field goes southward. This is forecast several days in advance from coupling primarily associated a positively directed tangential (Bt) field especially in the spring and fall.